Last month the Resolution Foundation published Saving private renters, making the case for unfreezing Local Housing Allowance (LHA) in the Budget on 28 October. It is a good report and the headline numbers are grim: 1.1 million low-income renters face a gap between the help they get with their rent and the rent they actually pay. The number the papers picked up came from London – a typical shortfall of £324 a month for a two-bed in inner east London.
London is where the gaps are biggest in pounds. No argument there. But it is not where the freeze is biting fastest.
A quick recap for anyone who isn’t deep into the UK welfare system. LHA is the cap on how much help with rent a private tenant on Universal Credit or Housing Benefit can get. It is meant to cover the cheapest 30% of rents in each local market. It was last reset in April 2024, using rents collected up to September 2023, and it has been frozen ever since.
So the question is simple: how far have rents moved since then?
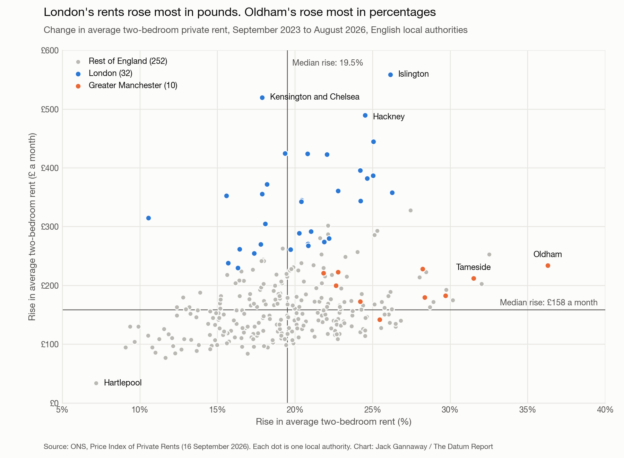
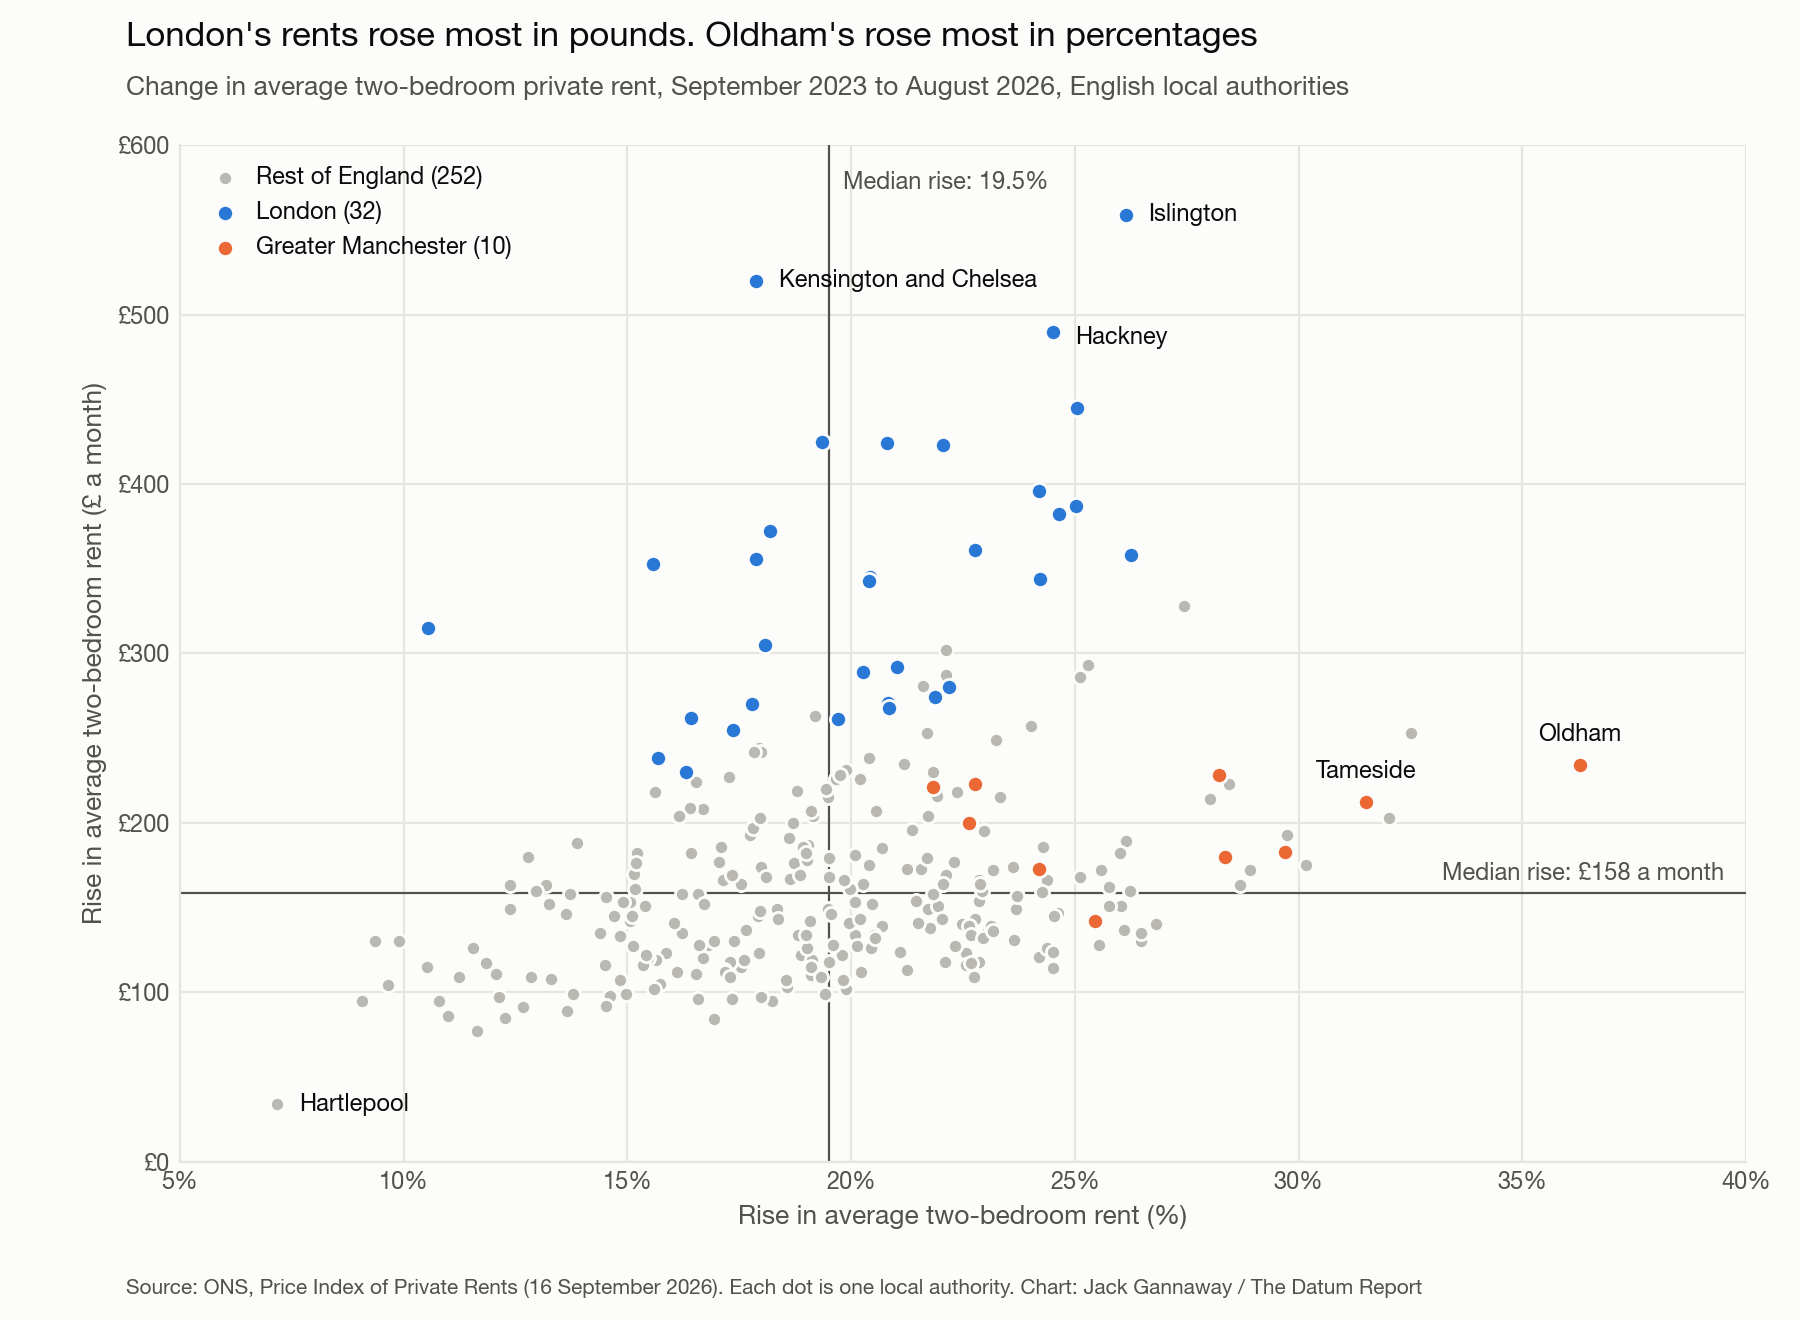
Quite a long way. According to the ONS, the average two-bed in England now costs £214 a month more than it did in September 2023, a rise of 19%. The LHA hasn’t moved a penny.
Now look at where the biggest rises are. Top of the table is Oldham, where the average two-bed has gone from £645 to £879 a month – up 36% in under three years. And it isn’t a lone outlier. Five of Greater Manchester’s ten boroughs are in the top 12 in England, and all ten have beaten the national median.
The regional picture says the same thing. Rents are up by nearly a quarter in the North East and North West, against under a fifth in London, and the north is still pulling ahead. Broadly, the cheaper a place was to begin with, the faster its rents have climbed.
None of this means London has got off lightly. The average two-bed in the capital is up £364 a month, and in Islington it is up £559. In cash terms, Londoners are still taking the biggest hit.
So there are really two different problems here. In London the freeze has created the biggest gaps in cash. In the north, the frozen rate is losing touch with the local market fastest.
Oldham makes this concrete. You can’t compare an LHA rate directly with a council’s average rent – LHA areas don’t follow council boundaries, and the rate is pitched below the average by design. But look at the direction of travel. The LHA for a two-bed in the Oldham and Rochdale area is about £578 a month. When the rents behind that rate were collected, the average two-bed in Oldham cost £645. Today it is £879.
You might hope that pay rises have taken some of the sting out of this for renters in work. They haven’t. In the North West, median pay has risen by about 17% since September 2023, while rents have risen by more than 23%. In the part of Greater Manchester that covers Oldham, pay has gone up by less than half as much as Oldham’s rents.
Back in 2014 I wrote about how London benefits disproportionately from the attention and resources of the whole country. The coverage of the LHA freeze has a whiff of the same thing. If the Chancellor does unfreeze it on 28 October, the biggest increases in pounds will go to London households, because that is where the gaps are biggest. But the renters who have fallen furthest behind, proportionally, are in Oldham, Tameside and the rest of the north.
The freeze is a London story in pounds. In percentages, it’s a northern one.
Data: ONS Price Index of Private Rents (rents to August 2026); DWP/VOA Local Housing Allowance rates for 2025/26 and 2026/27; ONS/HMRC PAYE Real Time Information (pay to August 2026, early estimate). Explore the figures for your own council at The Datum Report.