Birmingham has the highest claimant count in Britain. It is the wrong number to watch.

Birmingham’s claimant count is the highest of any local authority in Britain: 78,000 people in August 2026, 10% of everyone of working age, against 7% in the next highest places. It gets read as proof of the city’s decline. It is not a count of people out of work, and most of its recent rise was decided in Westminster.

The city does have a serious employment problem, and it is a much larger one. Just 67% of Birmingham’s people of working age are in work, against 76% across England: a shortfall of about 68,000 people. That gap has run between eight and fourteen points in every year since 2004, and it barely moves. Birmingham’s claimant count sits about 8,700 above its own 2022 share of the national total – less than an eighth of the employment shortfall, on a number that swings with the rules.

The number that moves is not the number that matters.

The count is not a count of people out of work

It counts everyone required to look for work as a condition of their benefit, which includes people already in a job if they earn below a threshold the government sets.

That threshold moved twice. In January 2023 it rose to £617 a month; in May 2024 it rose again to £892. The Department for Work and Pensions estimated that the two changes would bring 120,000 and then 180,000 more people into the count. Nobody lost a job. The effect is plain in the national series: England’s count went from 1.32m in August 2023 to 1.55m a year later, and has since drifted back to 1.49m.
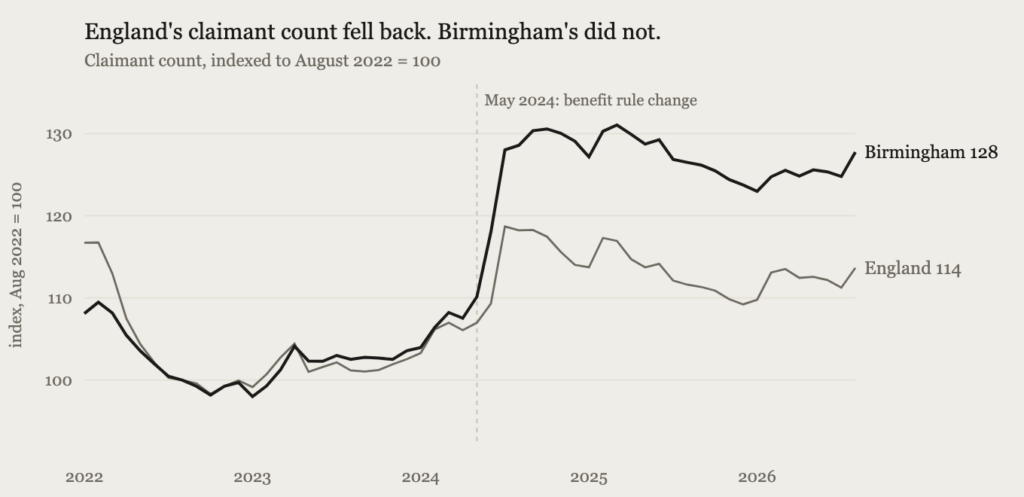
Birmingham's claimant count rose with the May 2024 rule change and stayed up, while England's fell back.
Claimant count indexed to August 2022 = 100. Source: ONS via Nomis.

Low pay and no work are not the same condition, and the count does not separate them. Trussell found that 30% of people referred to food banks in 2024 were in working households. Birmingham is a lower-paid city than most: median monthly pay for its payrolled employees was £2,400 in August 2025, against £2,600 across the UK, and it has run 7% to 9% below the UK figure for a decade. A threshold set in pounds a month catches a larger share of workers in a lower-paid city.

The Department for Work and Pensions publishes the split between claimants who are working and those who are not at national level only. How many of Birmingham’s 78,000 have a job is therefore not knowable from published data.

The gap that does not move
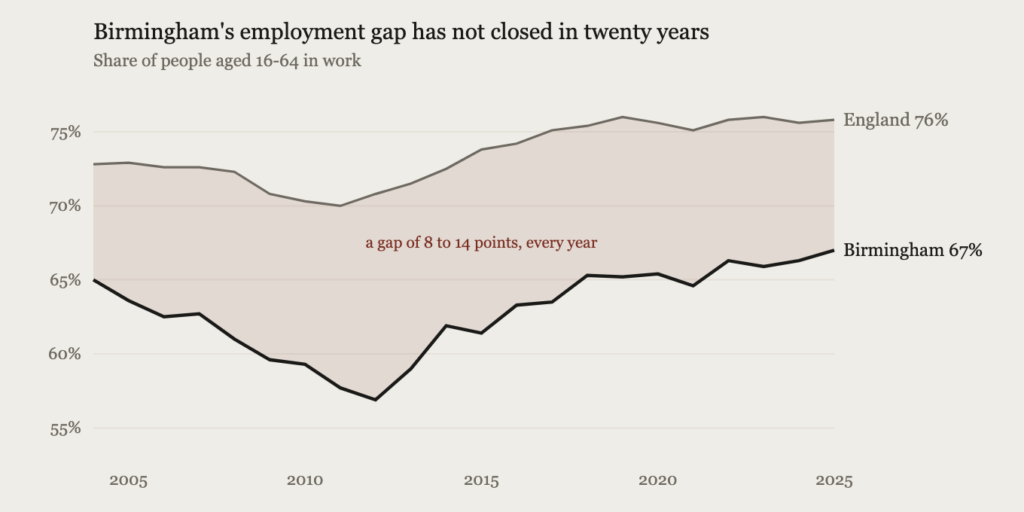
Birmingham's employment rate has been 8 to 14 points below England's in every year since 2004.
Share of residents aged 16-64 in work. Source: Annual Population Survey via Nomis.

In the year to March 2026, 67% of Birmingham’s people of working age were in work. The figure for England was 76%. That gap is not new. It has been there every year the survey has covered the city: eight points at its narrowest, in 2004; fourteen at its widest, in 2012; nine in 2025. Economic inactivity shows the same shape, 27% against England’s 21%.

Across Birmingham’s 760,000 people of working age, a nine-point gap is about 68,000 people. The claimant count, by comparison, is around 8,700 above what the city’s 2022 share of the national total would predict. The larger number has held for two decades without making news; the smaller one moved on a rule change and made headlines.

Where the gap shows

It shows at the bottom of the labour market. In July 2026 the University of Birmingham’s City-REDI institute published Inspiring Futures, commissioned by the Rigby Foundation, describing a “perfect storm” in youth employment. Its central finding concerns the first rung: entry-level or “starter” jobs in the area have fallen by 49% in a decade. The report projects a £3.1bn output loss and 28,000 fewer jobs across the West Midlands by 2030 if that is not reversed.

Professor Anne Green, the institute’s co-director, said the employment and skills system “remains too fragmented, and outcomes are not yet where they need to be.” Steve Rigby, who funded the work, said: “we are not facing a failure of ambition among young people, but a failure of opportunity.”

In May 2026 Birmingham had 16,000 claimants aged 18 to 24, a rate of 19%. And it reaches the classroom: in January 2025, 45% of the city’s pupils were eligible for a free school meal – 92,000 children, the highest proportion of any local authority in England. The share rose by more than three percentage points in a year, among the largest increases in the country, alongside Newham and Tower Hamlets.

The number to watch

Two decades of that gap have outlasted the financial crisis, austerity and a pandemic. It widened to almost fourteen points by 2012 and has narrowed since, but it has never dropped below the eight points recorded in 2004.

The claimant count will keep moving. It rose when Westminster raised a threshold, fell when the effect washed through, and will move again the next time the rules change. None of that will say whether Birmingham is catching up. The employment rate does, and the city has not.

A note on the figures. The employment rate comes from the Annual Population Survey, which is a sample. The Office for National Statistics publishes a confidence measure alongside it, plus or minus 3.1 points for Birmingham against 0.3 for England, but does not document how that measure is derived. The gap is about three times it and carries the same sign in all twenty-two years, which is why a single year’s movement is not read as a trend here.

Sources. Claimant count, employment rate and economic inactivity: ONS via Nomis, to August 2026 and to the year ending March 2026; Birmingham City Council’s own monthly update gives 77,925 and 10.1%, against 77,930 from Nomis. Payrolled employees and median pay: HMRC PAYE Real Time Information. Free school meals: DfE spring school census, January 2025. Threshold changes: DWP regulations and Hansard. Starter jobs, youth employment and the quotations: City-REDI, Inspiring Futures, 15 July 2026. Food bank referrals: Trussell.
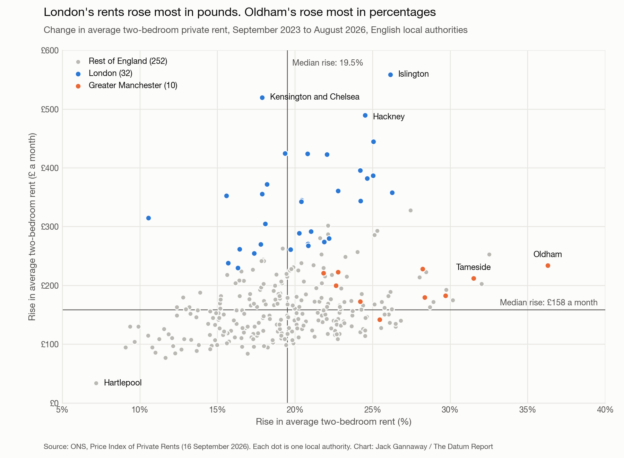
Scatter chart of 294 English local authorities. London boroughs have the biggest rises in pounds, up to £559 a month in Islington. Oldham has the biggest percentage rise, 36%, with Tameside and other Greater Manchester boroughs also well above the median rise of 19.5%.

The housing benefit freeze is biting fastest up north

Last month the Resolution Foundation published Saving private renters, making the case for unfreezing Local Housing Allowance (LHA) in the Budget on 28 October. It is a good report and the headline numbers are grim: 1.1 million low-income renters face a gap between the help they get with their rent and the rent they actually pay. The number the papers picked up came from London – a typical shortfall of £324 a month for a two-bed in inner east London.

London is where the gaps are biggest in pounds. No argument there. But it is not where the freeze is biting fastest.

A quick recap for anyone who isn’t deep into the UK welfare system. LHA is the cap on how much help with rent a private tenant on Universal Credit or Housing Benefit can get. It is meant to cover the cheapest 30% of rents in each local market. It was last reset in April 2024, using rents collected up to September 2023, and it has been frozen ever since.

So the question is simple: how far have rents moved since then?

Quite a long way. According to the ONS, the average two-bed in England now costs £214 a month more than it did in September 2023, a rise of 19%. The LHA hasn’t moved a penny.

Now look at where the biggest rises are. Top of the table is Oldham, where the average two-bed has gone from £645 to £879 a month – up 36% in under three years. And it isn’t a lone outlier. Five of Greater Manchester’s ten boroughs are in the top 12 in England, and all ten have beaten the national median.

The regional picture says the same thing. Rents are up by nearly a quarter in the North East and North West, against under a fifth in London, and the north is still pulling ahead. Broadly, the cheaper a place was to begin with, the faster its rents have climbed.

None of this means London has got off lightly. The average two-bed in the capital is up £364 a month, and in Islington it is up £559. In cash terms, Londoners are still taking the biggest hit.

So there are really two different problems here. In London the freeze has created the biggest gaps in cash. In the north, the frozen rate is losing touch with the local market fastest.

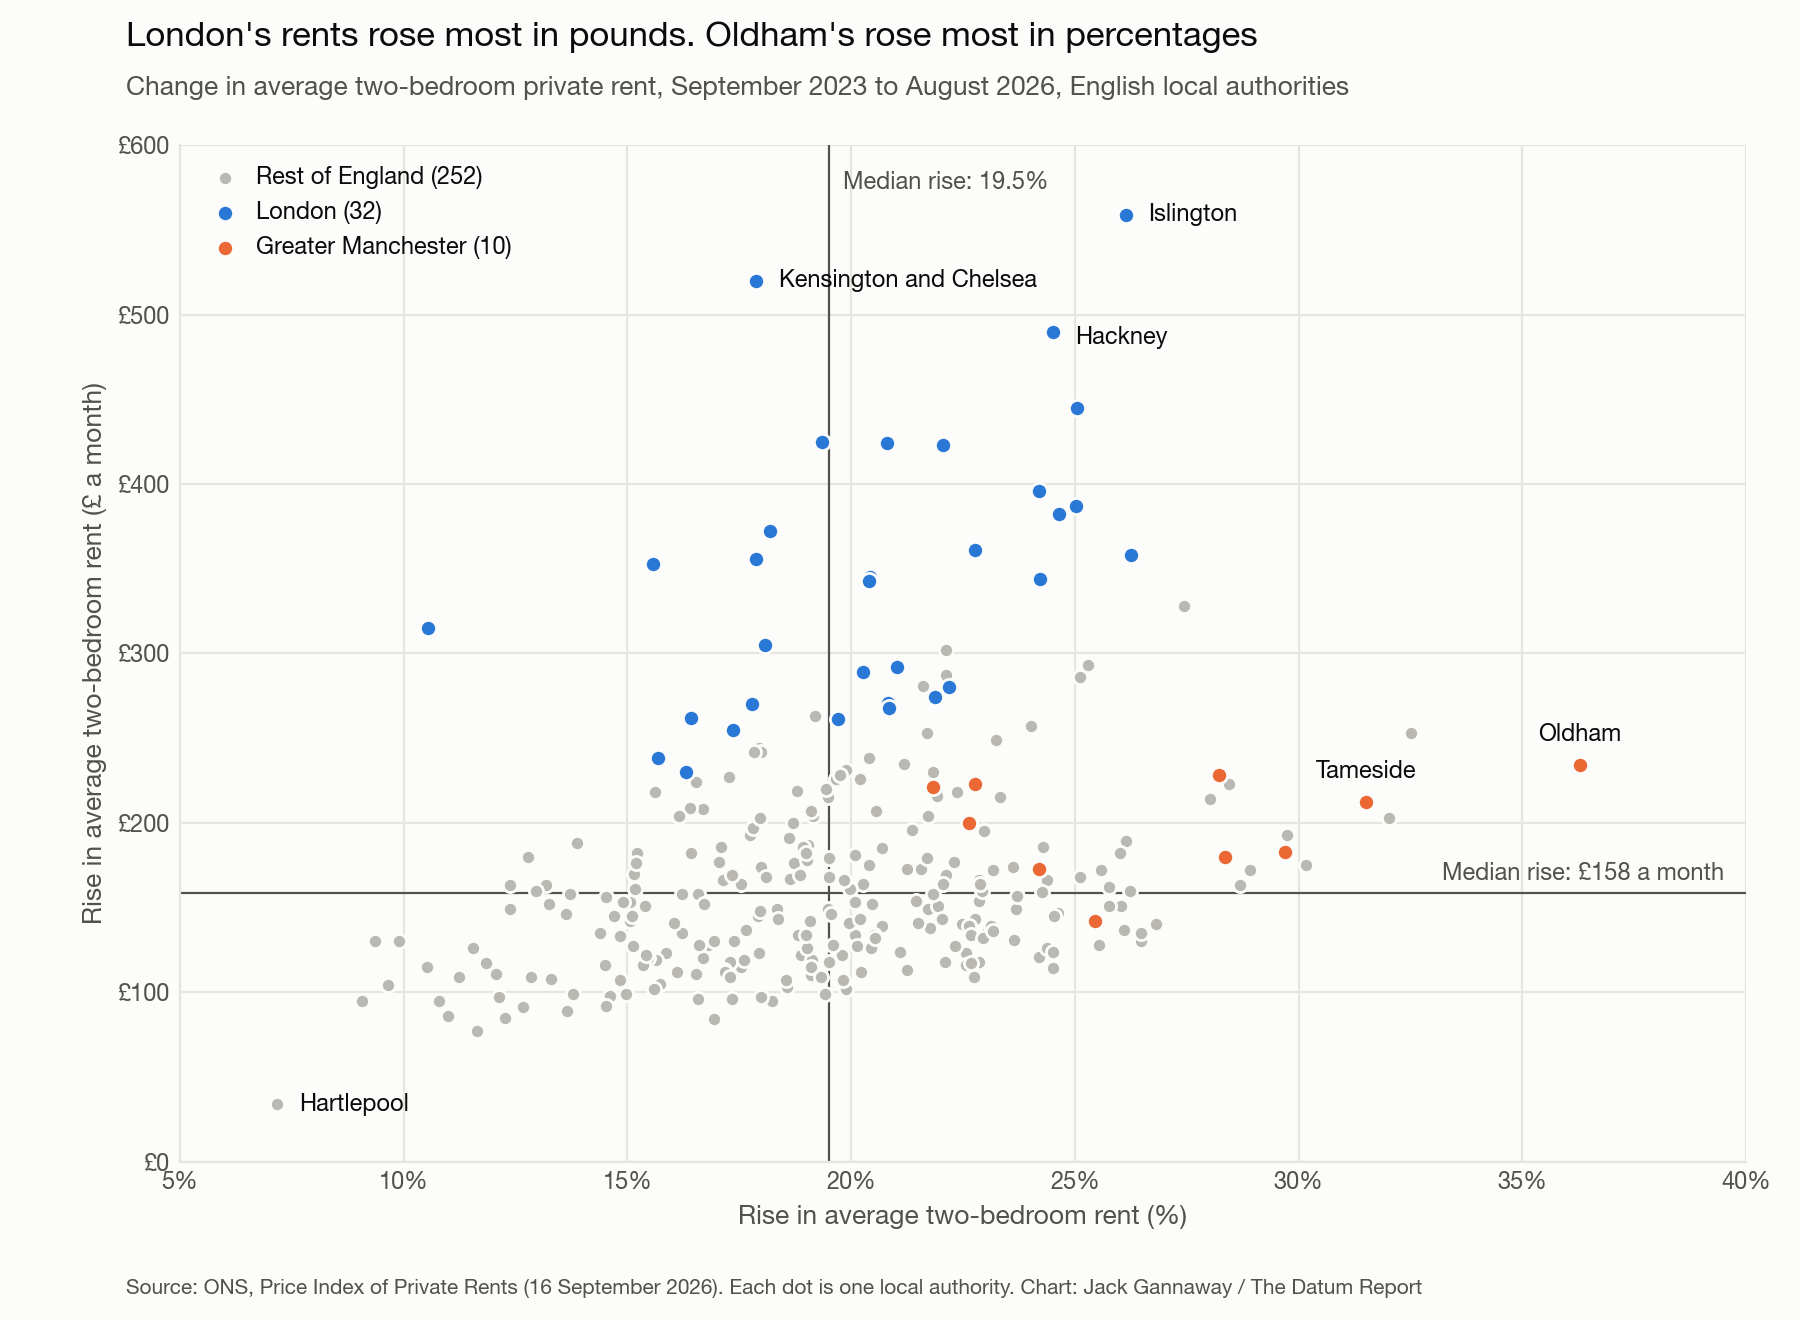
Scatter chart of 294 English local authorities. London boroughs have the biggest rises in pounds, up to £559 a month in Islington. Oldham has the biggest percentage rise, 36%, with Tameside and other Greater Manchester boroughs also well above the median rise of 19.5%.
Each dot is one English local authority. Across: the rise in average two-bedroom rent between September 2023 and August 2026, in per cent. Up: the same rise in pounds a month. London boroughs are blue and Greater Manchester’s ten boroughs orange. Source: ONS, Price Index of Private Rents.

Oldham makes this concrete. You can’t compare an LHA rate directly with a council’s average rent – LHA areas don’t follow council boundaries, and the rate is pitched below the average by design. But look at the direction of travel. The LHA for a two-bed in the Oldham and Rochdale area is about £578 a month. When the rents behind that rate were collected, the average two-bed in Oldham cost £645. Today it is £879.

You might hope that pay rises have taken some of the sting out of this for renters in work. They haven’t. In the North West, median pay has risen by about 17% since September 2023, while rents have risen by more than 23%. In the part of Greater Manchester that covers Oldham, pay has gone up by less than half as much as Oldham’s rents.

Back in 2014 I wrote about how London benefits disproportionately from the attention and resources of the whole country. The coverage of the LHA freeze has a whiff of the same thing. If the Chancellor does unfreeze it on 28 October, the biggest increases in pounds will go to London households, because that is where the gaps are biggest. But the renters who have fallen furthest behind, proportionally, are in Oldham, Tameside and the rest of the north.

The freeze is a London story in pounds. In percentages, it’s a northern one.


Data: ONS Price Index of Private Rents (rents to August 2026); DWP/VOA Local Housing Allowance rates for 2025/26 and 2026/27; ONS/HMRC PAYE Real Time Information (pay to August 2026, early estimate). Explore the figures for your own council at The Datum Report.

The electric vehicle transition is reshaping procurement pay in the West Midlands

Buyers and procurement officers in the West Midlands were the lowest paid in the country for their profession in 2024. By 2025, they were second only to London. The shift reflects something structural happening to the region’s labour market.


Few job titles sound less exciting than “buyer and procurement officer.” But the pay data for this occupation in 2025 tells an unexpectedly sharp story about what the transition to electric vehicles is doing to the West Midlands workforce.

Median annual pay for procurement professionals in the West Midlands rose from £32,292 to £40,824 between 2024 and 2025, an increase of 26%. Most other regions saw increases of 1-9% or stayed flat. Scotland and the North West barely moved.

Article content

A region built on supply chains

The West Midlands accounts for around 32% of UK automotive employment and is home to JLR, Stellantis, and a dense network of tier-1 and tier-2 suppliers. For decades that concentration made the region a natural home for procurement professionals who understood how automotive supply chains worked.

The shift to electric vehicles is changing the skills that concentration demands. New supply chains for battery materials, power electronics, and new categories of component require procurement professionals who can manage entirely different supplier relationships, often with overseas partners, and across materials with volatile pricing. That kind of specialist capability is in short supply nationally — and disproportionately in demand in the West Midlands.

Public investment is amplifying that demand. A £12.5m Supply Chain Transition Programme launched in 2025 specifically targets diversification into EV, battery, aerospace, and medtech supply chains. A £15m manufacturing transformation fund is also active. Regional manufacturing output is already more than 10% above 2019 levels, with 9,000 jobs added since 2023.

From lowest to near the top

In 2024, a procurement professional in the West Midlands earned roughly £4,000 less per year than one in London and around £5,000 less than one in the East Midlands. By 2025, the West Midlands had overtaken the East Midlands entirely and was within £800 of London’s median.

That kind of catch-up from a low base does not happen through routine salary reviews. It requires genuine demand pressure: employers competing for a limited pool of people with the right skills, in a region where those skills are suddenly more valuable than they used to be.

Reed’s 2025 procurement salary guide specifically identifies the West Midlands as one of theregions where procurement and supply chain salaries have increased the most, attributing it to the strong performance of transport and logistics firms — which in this region means, in practice, the automotive transition.

Why other regions stayed flat

London and the South East were already high-cost environments for procurement talent, so additional demand produces smaller percentage moves. Yorkshire, Scotland, and the North West have less manufacturing concentration and fewer large-scale EV transition anchors in their supplier base. There is no equivalent structural driver pushing procurement pay sharply upward in those regions right now.

Why radiographer pay surged in the West Midlands and fell in London

The same occupation, the same national pay scale, but very different regional stories. New data from Wage Wizard reveals what’s really happening to radiographer pay across the UK.

NHS radiographers work to a national pay scale. Agenda for Change rates are set centrally, apply uniformly across England, and moved by 5.5% in 2024-25. So why does the latest ONS earnings data show median annual pay for radiographers rising by 25% in the West Midlands while falling by 11% in London?

The answer tells you more about how the NHS is managing a workforce crisis than about pay rises but it is a genuinely important story about what is happening to radiography services across the country.

The West Midlands: a diagnostic centre building boom

The West Midlands has seen one of the most intensive expansions of Community Diagnostic Centres anywhere in England. Birmingham’s first CDC opened in 2024 at Washwood Heath; a North Solihull centre followed in spring 2025; a South Birmingham centre was announced for summer 2025. The West Midlands Imaging Network now spans 15 NHS trusts serving 6.7 million patients, and Midlands CDCs have collectively delivered nearly 1.5 million diagnostic tests since mid-2024.

Building that capacity quickly, in a profession with a 13% national vacancy rate, means competing hard for experienced staff. CDCs disproportionately recruit Band 6 and Band 7 radiographers: the senior practitioners who can work more independently and handle the volume these facilities are designed to deliver. In 2024, the West Midlands ASHE sample for this occupation was weighted toward entry-level and mid-grade workers. By 2025, a significant cohort of more senior, higher-paid staff had joined the regional workforce.

The result: median annual pay moving from £34,788 to £43,629 not because anyone received a 25% pay rise, but because the composition of who is working in the region shifted sharply upward in seniority.

That is a meaningful distinction. But it is also a real signal: the West Midlands is now a materially different labour market for experienced radiographers than it was twelve months ago.

London: the agency crackdown bites

London’s story runs in the opposite direction and has a different structural cause.

In 2024, London’s median radiographer pay of £53,944 sat well above the Agenda for Change Band 7 maximum of around £48,000. That premium reflects the high proportion of agency and bank staff captured in the London ASHE sample radiographers working at rates that can reach two to three times standard NHS pay. London NHS trusts, under persistent staffing pressure, had been among the heaviest users of temporary radiology staff.

In late 2024, that changed. The Health Secretary mandated a system-wide freeze on agency spending; NHS England cut total agency spend by nearly £1 billion in 2024-25, a reduction of around 30%. Radiology where the NHS had been spending an estimated £325 million per year on temporary staff, up 24% year-on-year was a prime target.

By April 2025, when ASHE data is collected, the high-pay agency cohort that had inflated London’s median was significantly smaller. The median fell to £47,855, much closer to the standard AfC Band 6-7 range, not because any radiographer took a pay cut, but because fewer high-cost temporary workers were captured in the data.

What the data actually shows

The chart below shows median annual pay for medical radiographers by region in 2024 and 2025, for the eight regions with sufficient data quality to report reliably.

Article content

The broad picture is one of convergence: the two lowest-paid regions in 2024 (West Midlands, £34,788; East Midlands, £36,413) have moved significantly toward the national centre of gravity. The outlier at the top (London, £53,944) has come down. Most other regions remained broadly stable.

What this means for radiographers and patients

For radiographers, the regional picture has become more equal but also more complex. The West Midlands is clearly hiring, and hiring at senior grades: it is potentially a good moment to be an experienced practitioner in that market. London’s apparent pay premium has narrowed considerably, though this reflects a reduction in lucrative agency work rather than a change in permanent salaries.

For patients, the CDC expansion in the West Midlands represents a genuine step-change in imaging capacity. The question is whether the workforce to sustain it is there: with a 13% national vacancy rate and an agency crackdown limiting the flexibility that trusts have relied on, the pressure on permanent radiography staff is not going away.

Explore pay for radiographers and hundreds of other occupations across every UK region at Wage Wizard

Analytics Innovation – are you working with AI yet?

In my previous post I discussed how common approaches to getting more impact from data will not on their own achieve a great deal, apart from increasing your costs. Here I will discuss a better way to look at the problem.

As with any business problem, it pays to start with your strategic goals – what hard things are you trying to achieve to deliver value for your customers, protect your business from competitors and return value to your owners? When you have a good understanding of this it becomes much easier to think about what you need to do with your data to achieve these goals.

The Analytics Impact Hierarchy

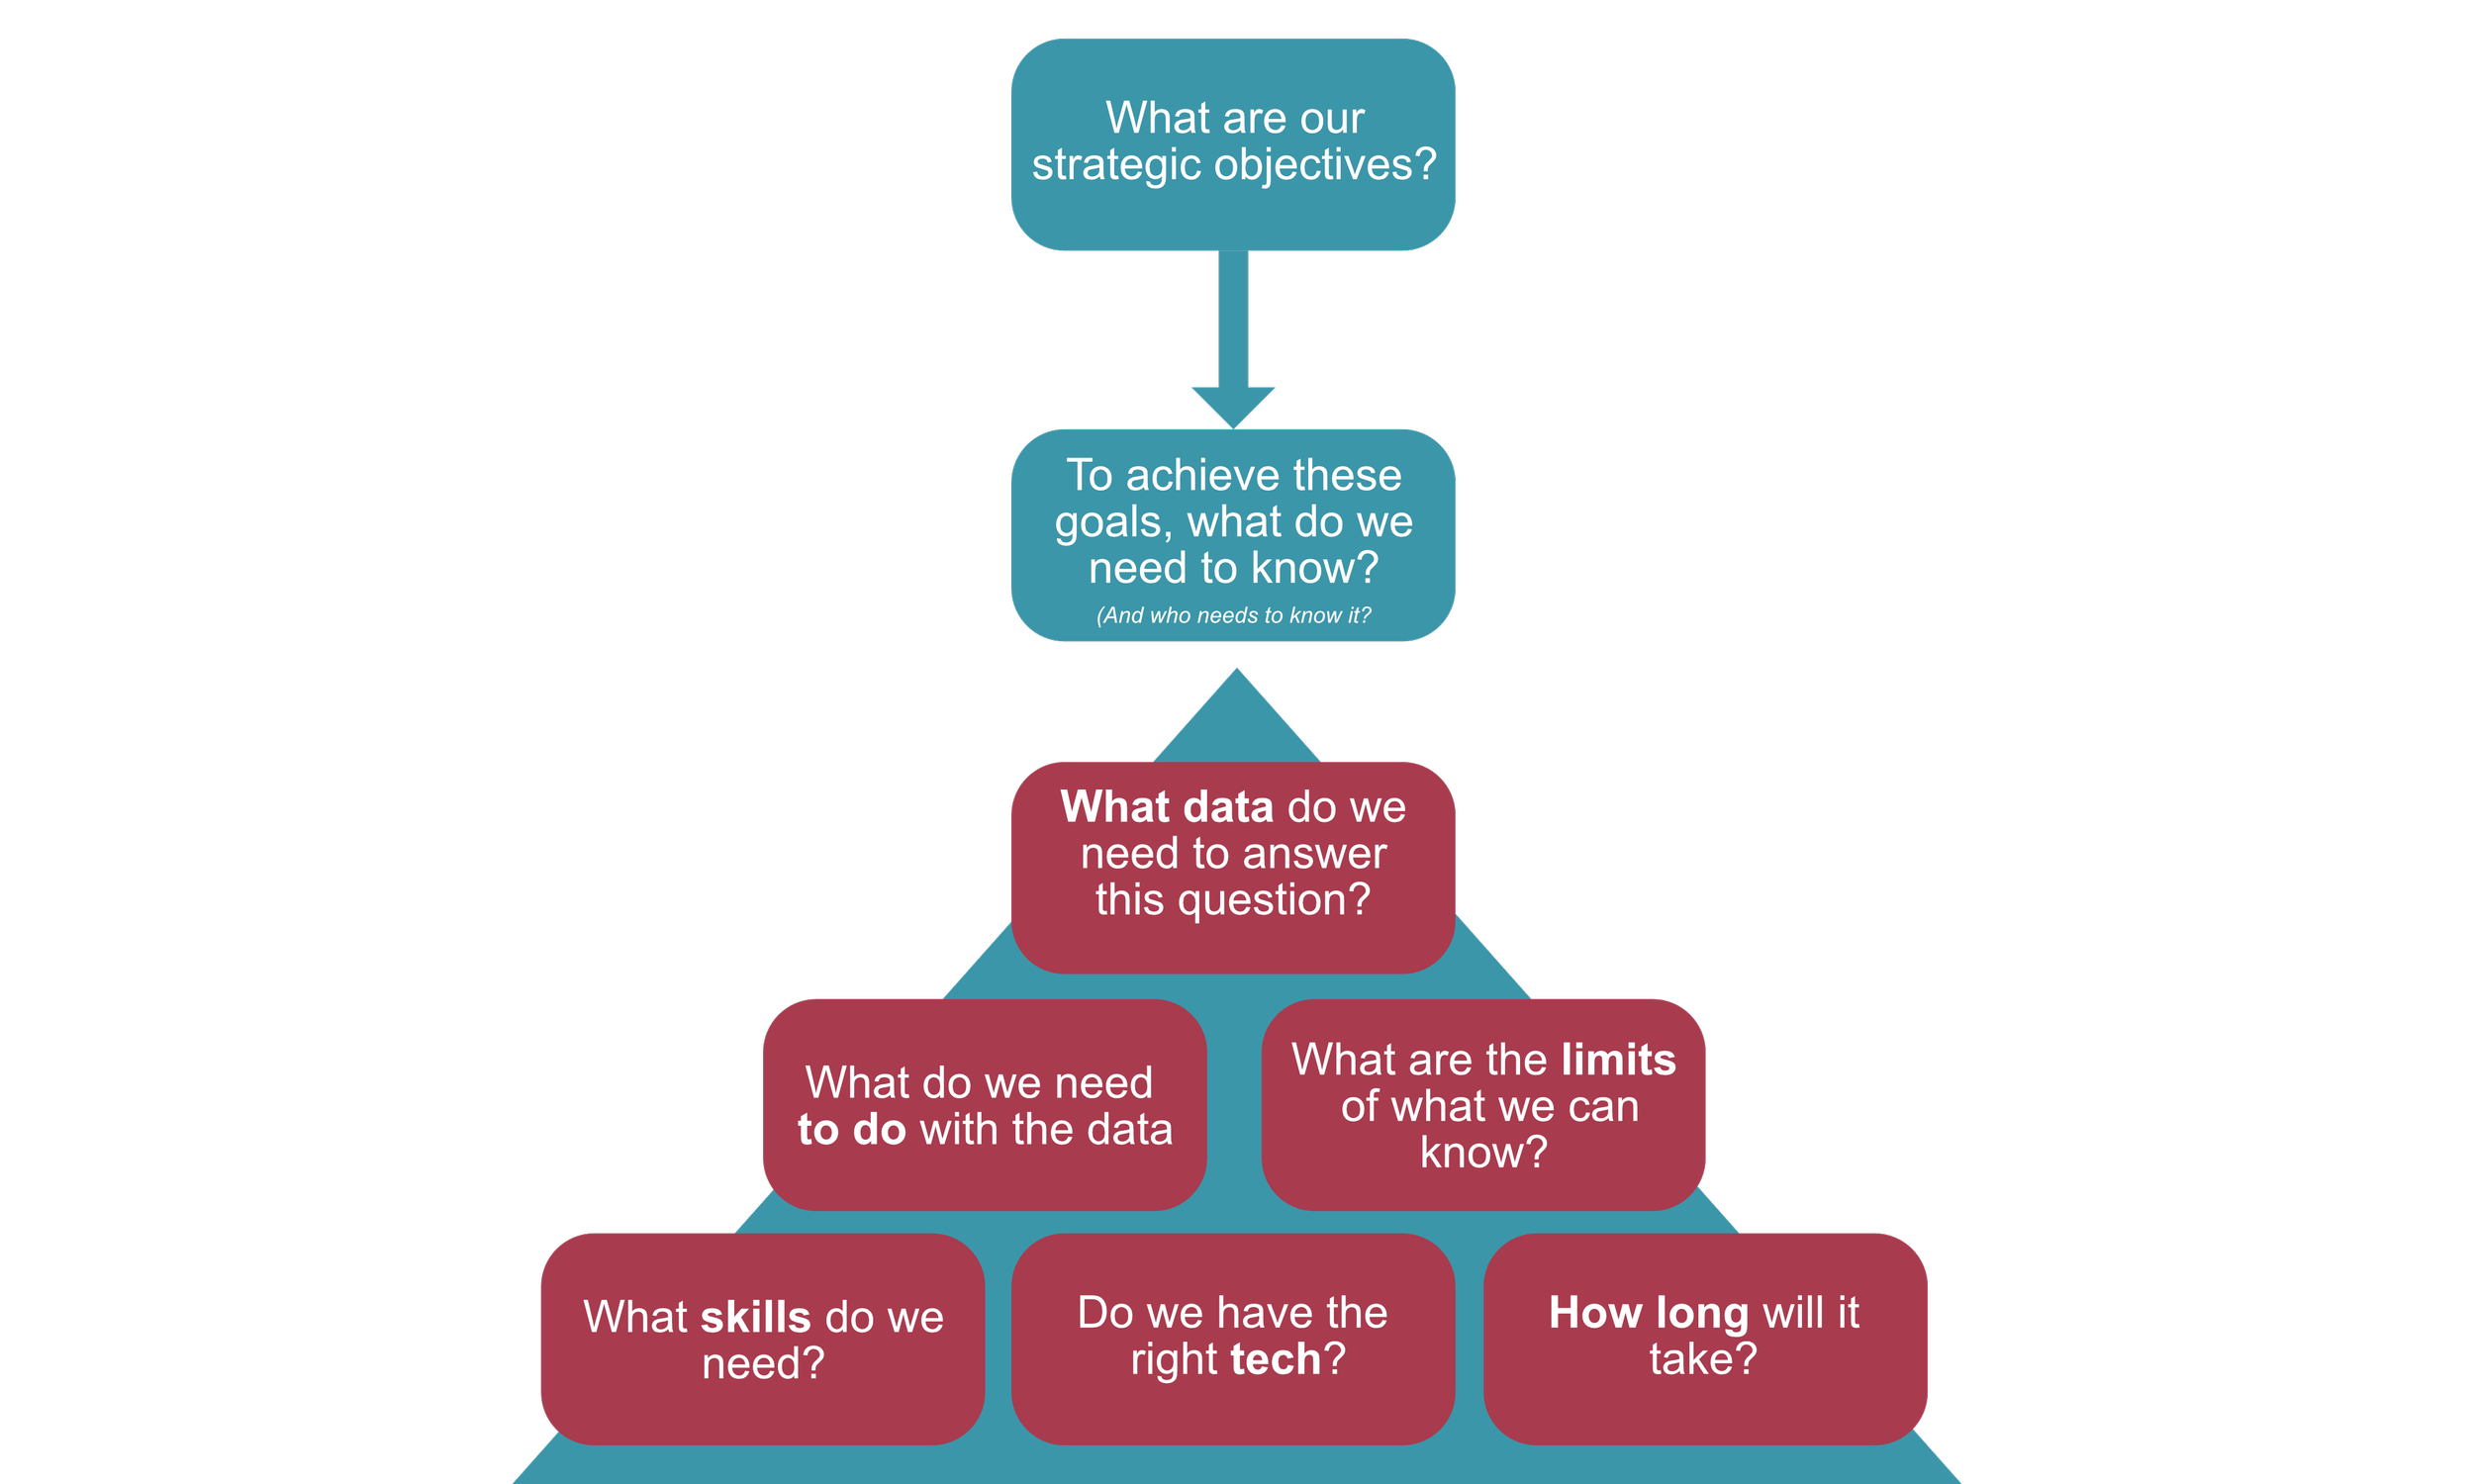
By starting with strategic goals, it becomes clearer what you need to know, and what steps you need to take to get there. This strategic goal is the goal of your innovation: you are trying to use analytics to developing new knowledge about your problem. This new knowledge will help you unlock your goal.

The five questions in the hierarchy start to build the plan for how you are going to develop this innovative knowledge. By answering each one you start to build a picture of how you can get more value out of your data by unlocking this goal.

The questions are arranged in descending order of importance – there is no equality here! Before going any further you need to answer the question what data do you need to answer your questions. If this data is unobtainable then you might need to revise your questions, or even your goal.

Once you know what data you need you can start to look at what you need to do with it and. to what extent it will be possible to answer your questions. For example, if you are trying to build a forecast but you don’t have much historical data then you are going to have to compromise on the precision of your forecast.

Only after looking at these three topics do we get to the more practical topics of skills and technology, and finally timing.

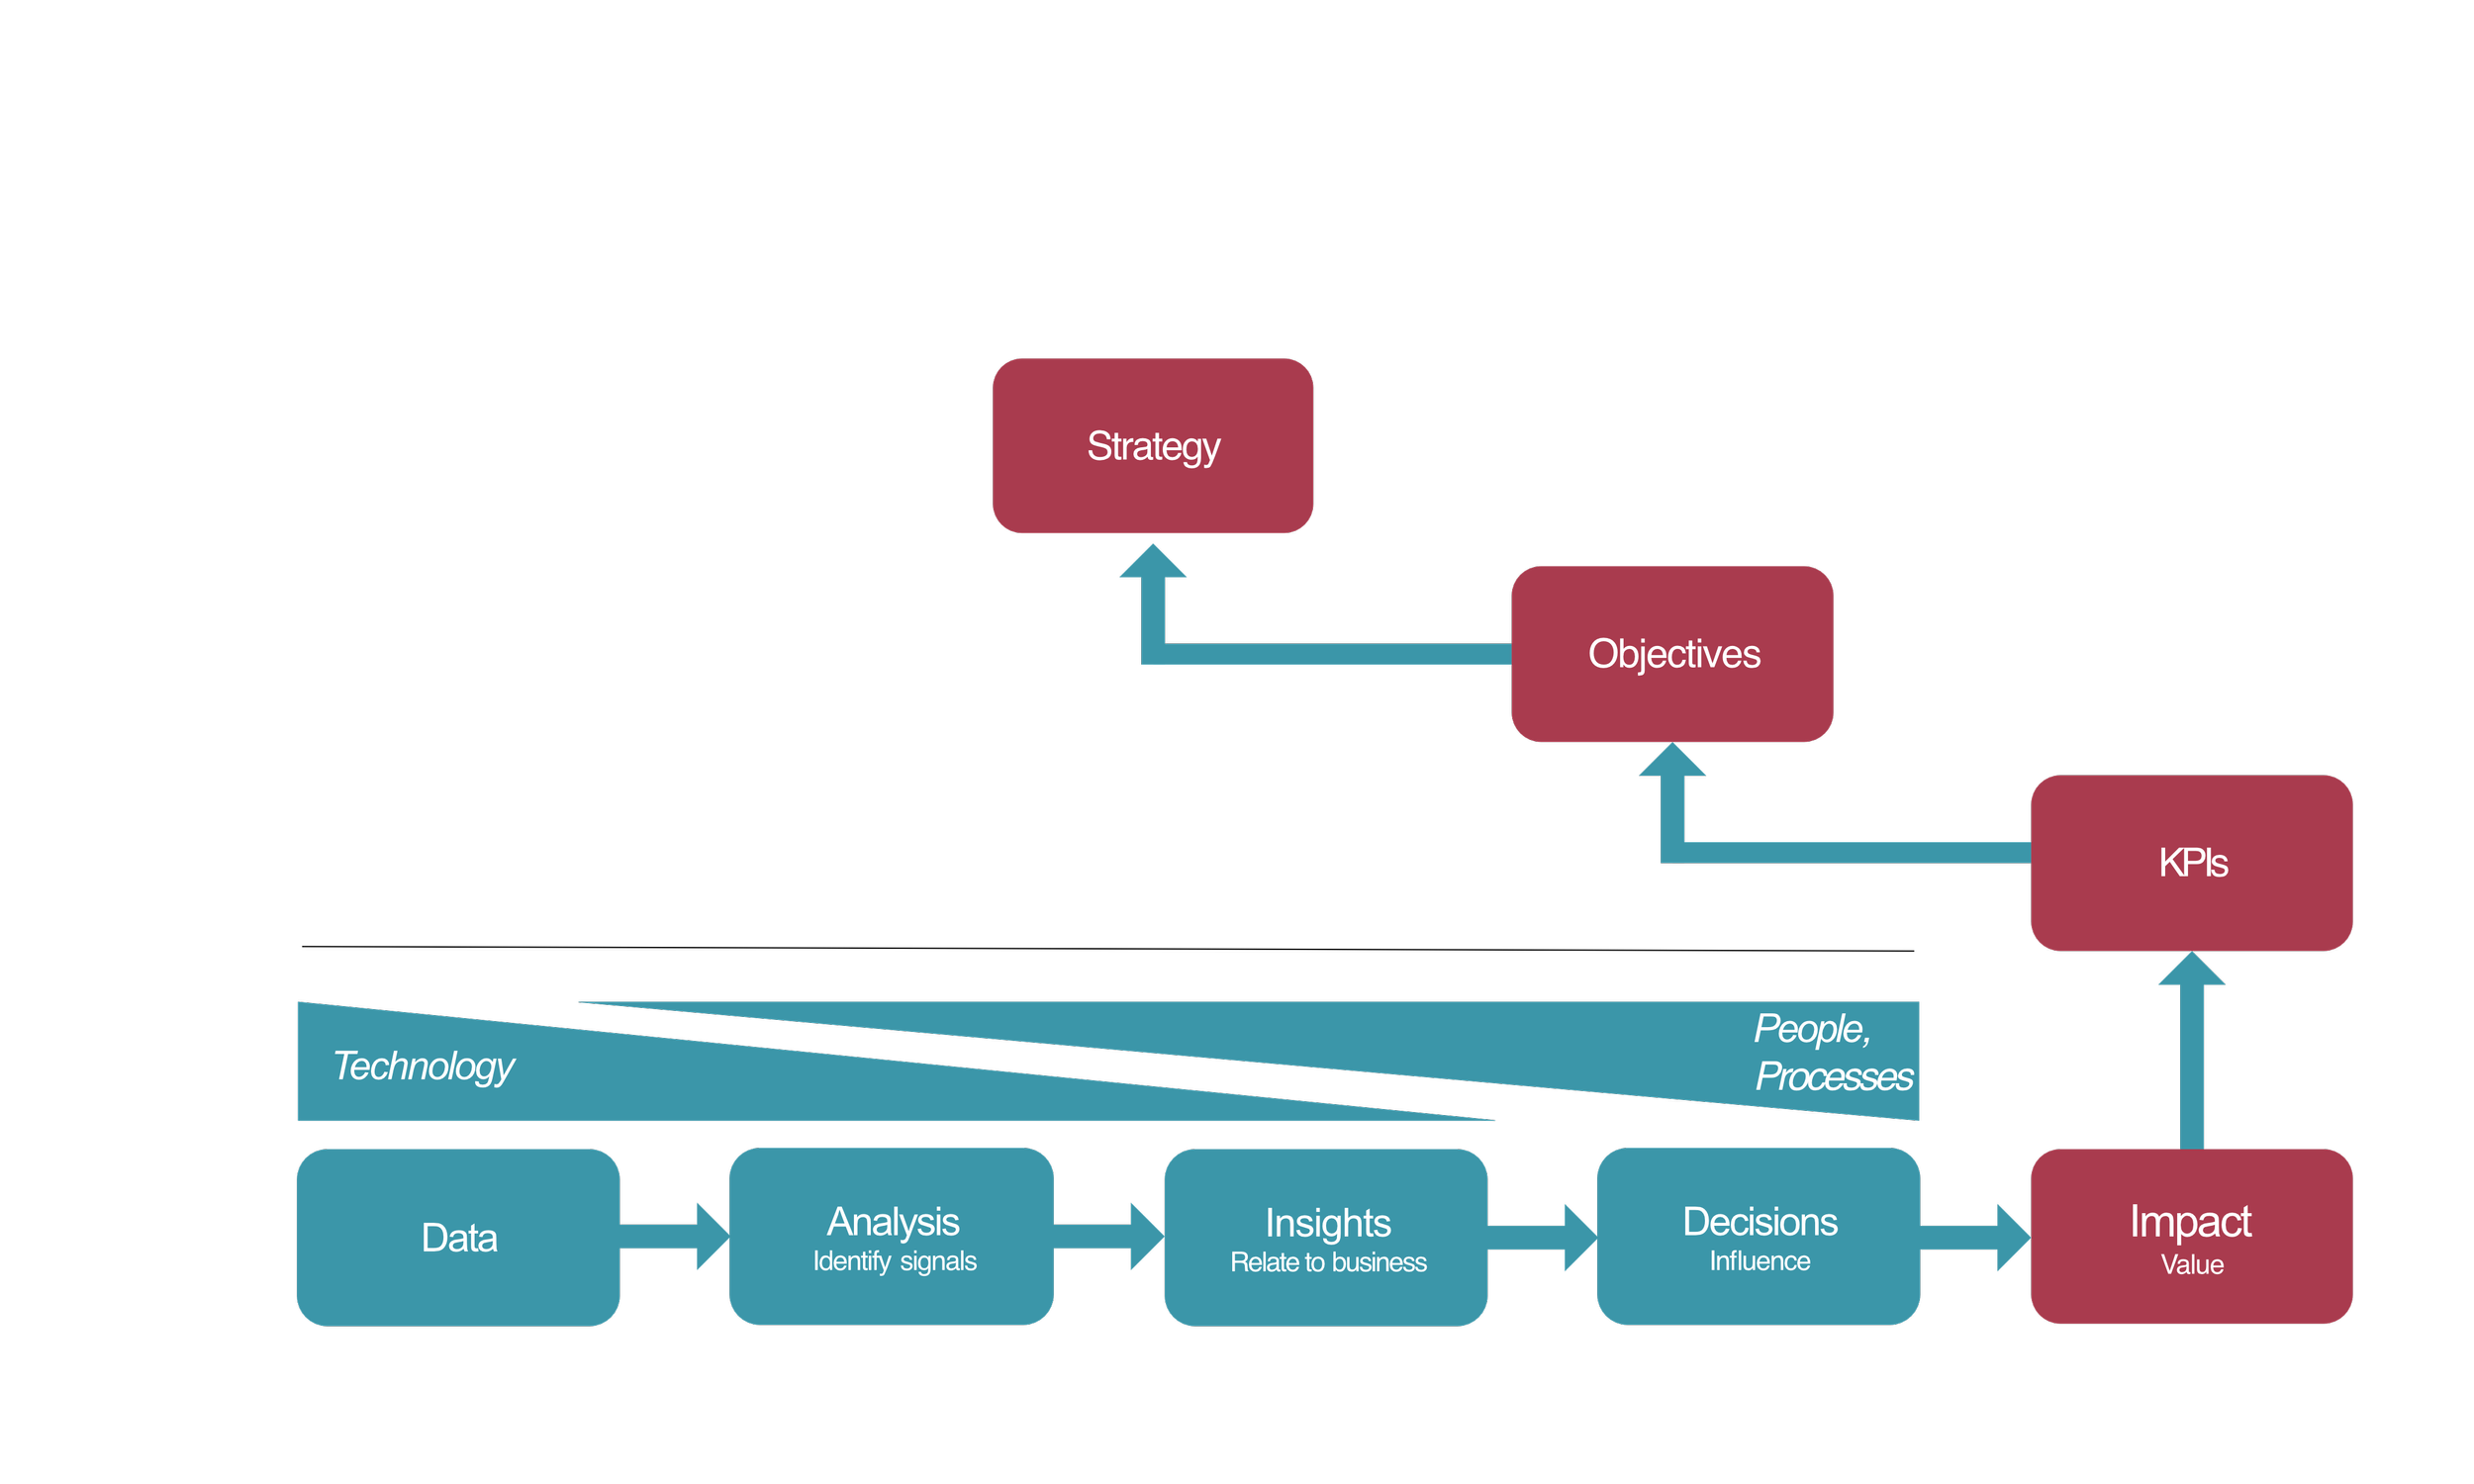
Looking at the problem from the perspective of these five questions is helpful for planning out how to achieve a single goal one time but it doesn’t help you build an organisation that can do analytics innovation again and again in a lean and efficient way.

Organisation resources need to work together to generate value

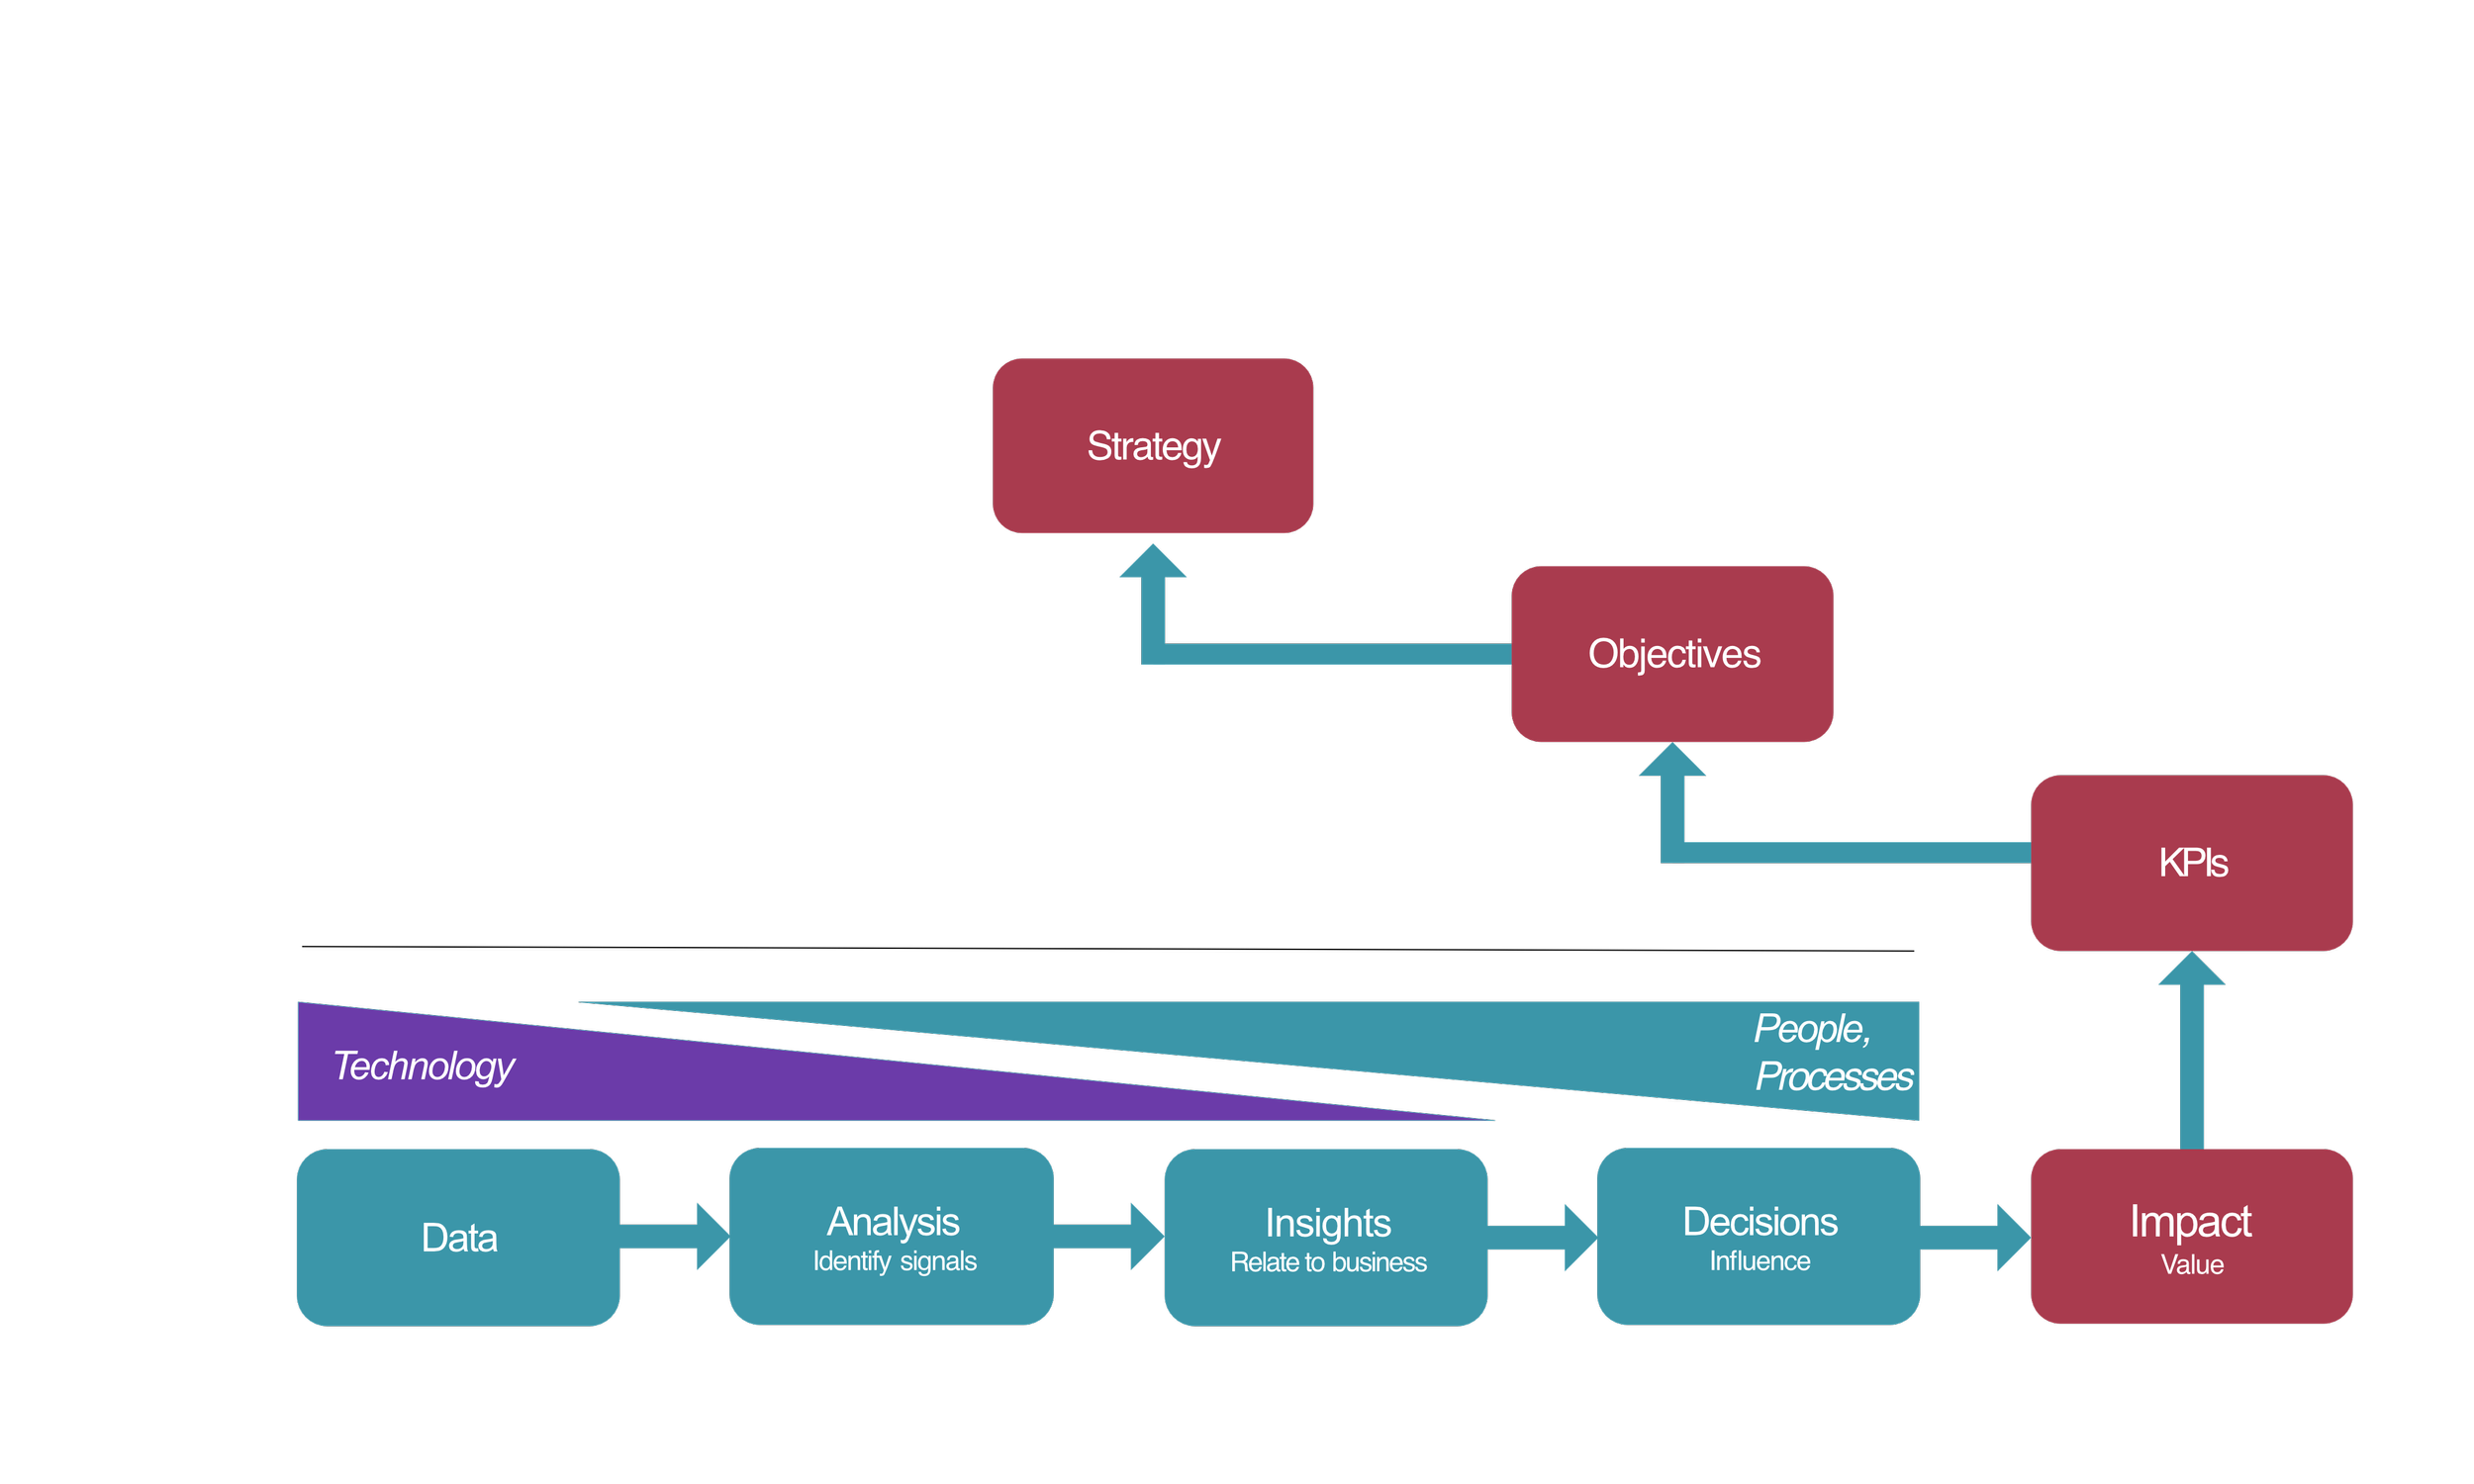
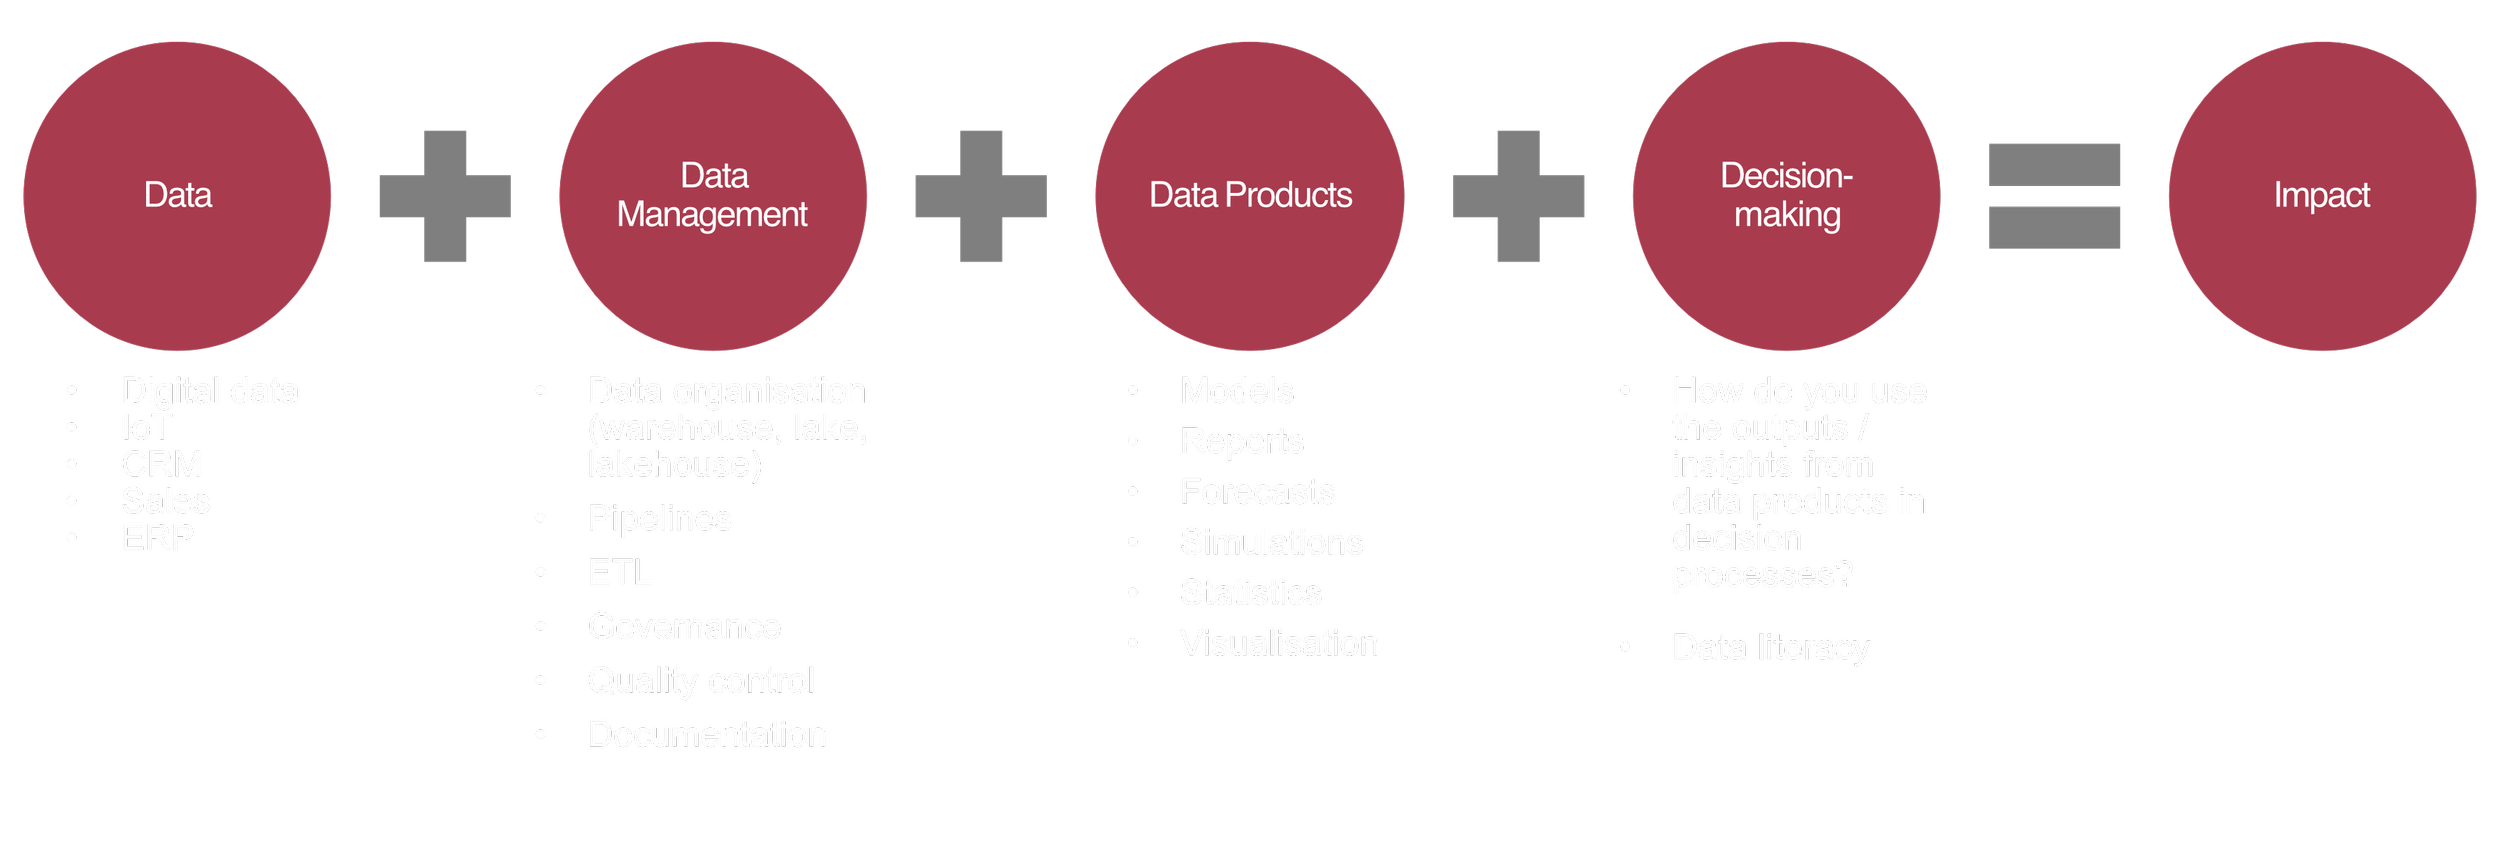
A key part of delivering analytics innovation efficiently is having resources that are not just good on their own but work well together. Data driven organisations have this kind of system embedded throughout, across every function, and at every level.

It is not only about technology, and it is not only about culture.

It is about multiple types of resource working together

But why are so many organisations struggling?

Organisations tend to focus too much on the technology and not enough on the system working together. This is understandable because the technology is more tangible, and usually gathered together under a Chief Information Officer or Chief Data Officer’s responsibilities.

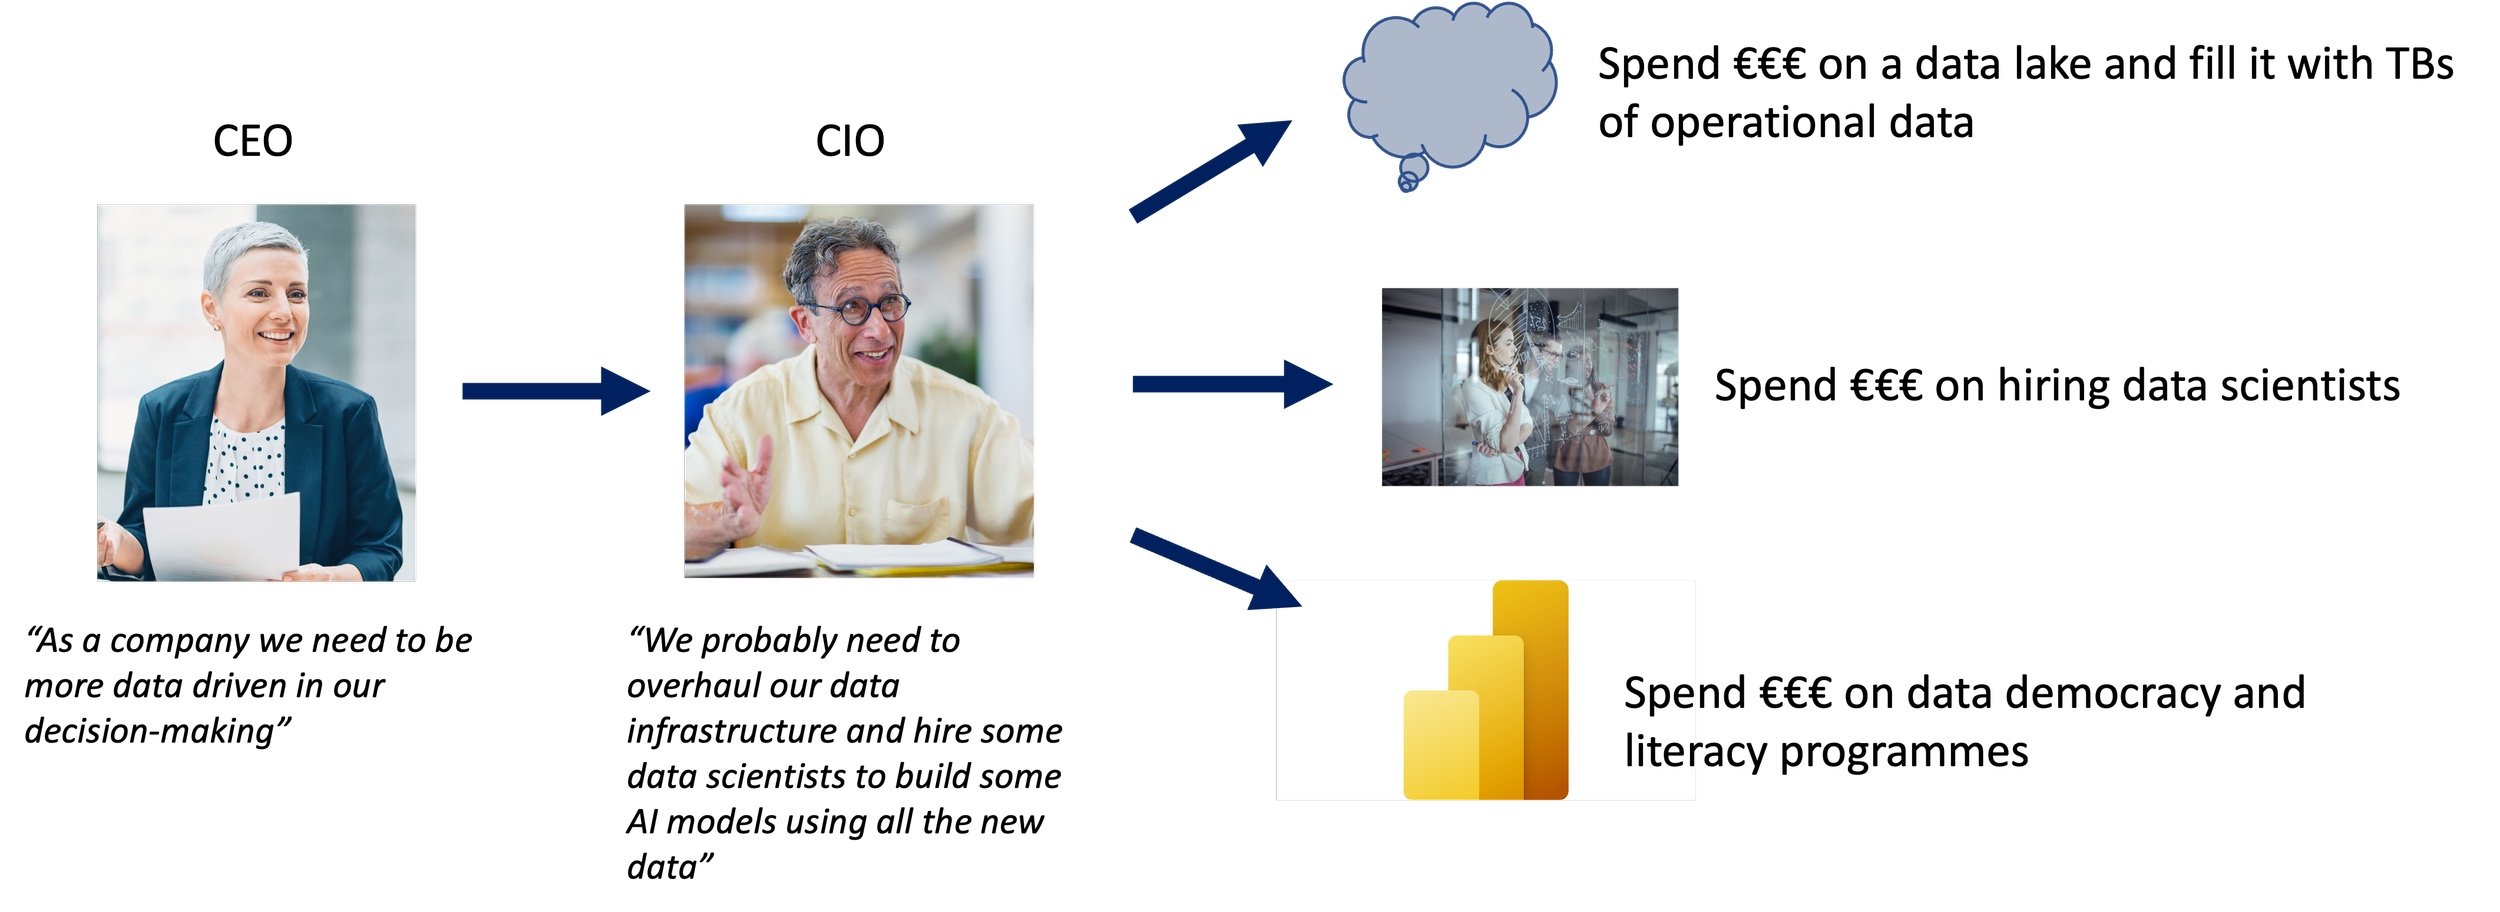
CDO – “I’m responsible for making the company more data driven.  If I make lots of reporting and no-code analytics tools available to everyone (data democracy) and give them enough training then they will just start making better decisions, right?”

There is a growing body of academic evidence that organisations that are more data driven perform better

  • Bryjolfsson & McElheran 2019 find that data-driven decision making (DDDM) is strongly associated with increased productivity. The benefits attributable to DDDM are distinct from those associated with other structured management practices or investment in IT, though the latter is an important complement.

  • Muller, Fay, vom Brocke (2018) find that productivity impact is positive(3%-7%) and significant for industries that are IT intensive (above median) and/or highly competitive (bottom 25% of HHI)

  • Wu, Hitt & Lou (2018) find results that “are consistent with the theory that data analytics are complementary to certain types of innovation because they enable firms to expand the search space of existing knowledge to combine into new technologies, as well as the theoretical arguments that data analytics support incremental process improvements“

So how can Future Consulting help you unlock some of those gains?

We help you identify and prioritise your opportunities for getting value from data (what are the strategic goals and related questions) and then support you in the implementation. As part of this implementation we look for opportunities to improve how your analytics resources are working together – making your analytics production line as lean and responsive as possible.

If you are interested in Analytics Innovation and get in touch.

Everyone wants to be data driven, but no one knows what it means, or how to achieve it

Many leaders say their organisations are struggling

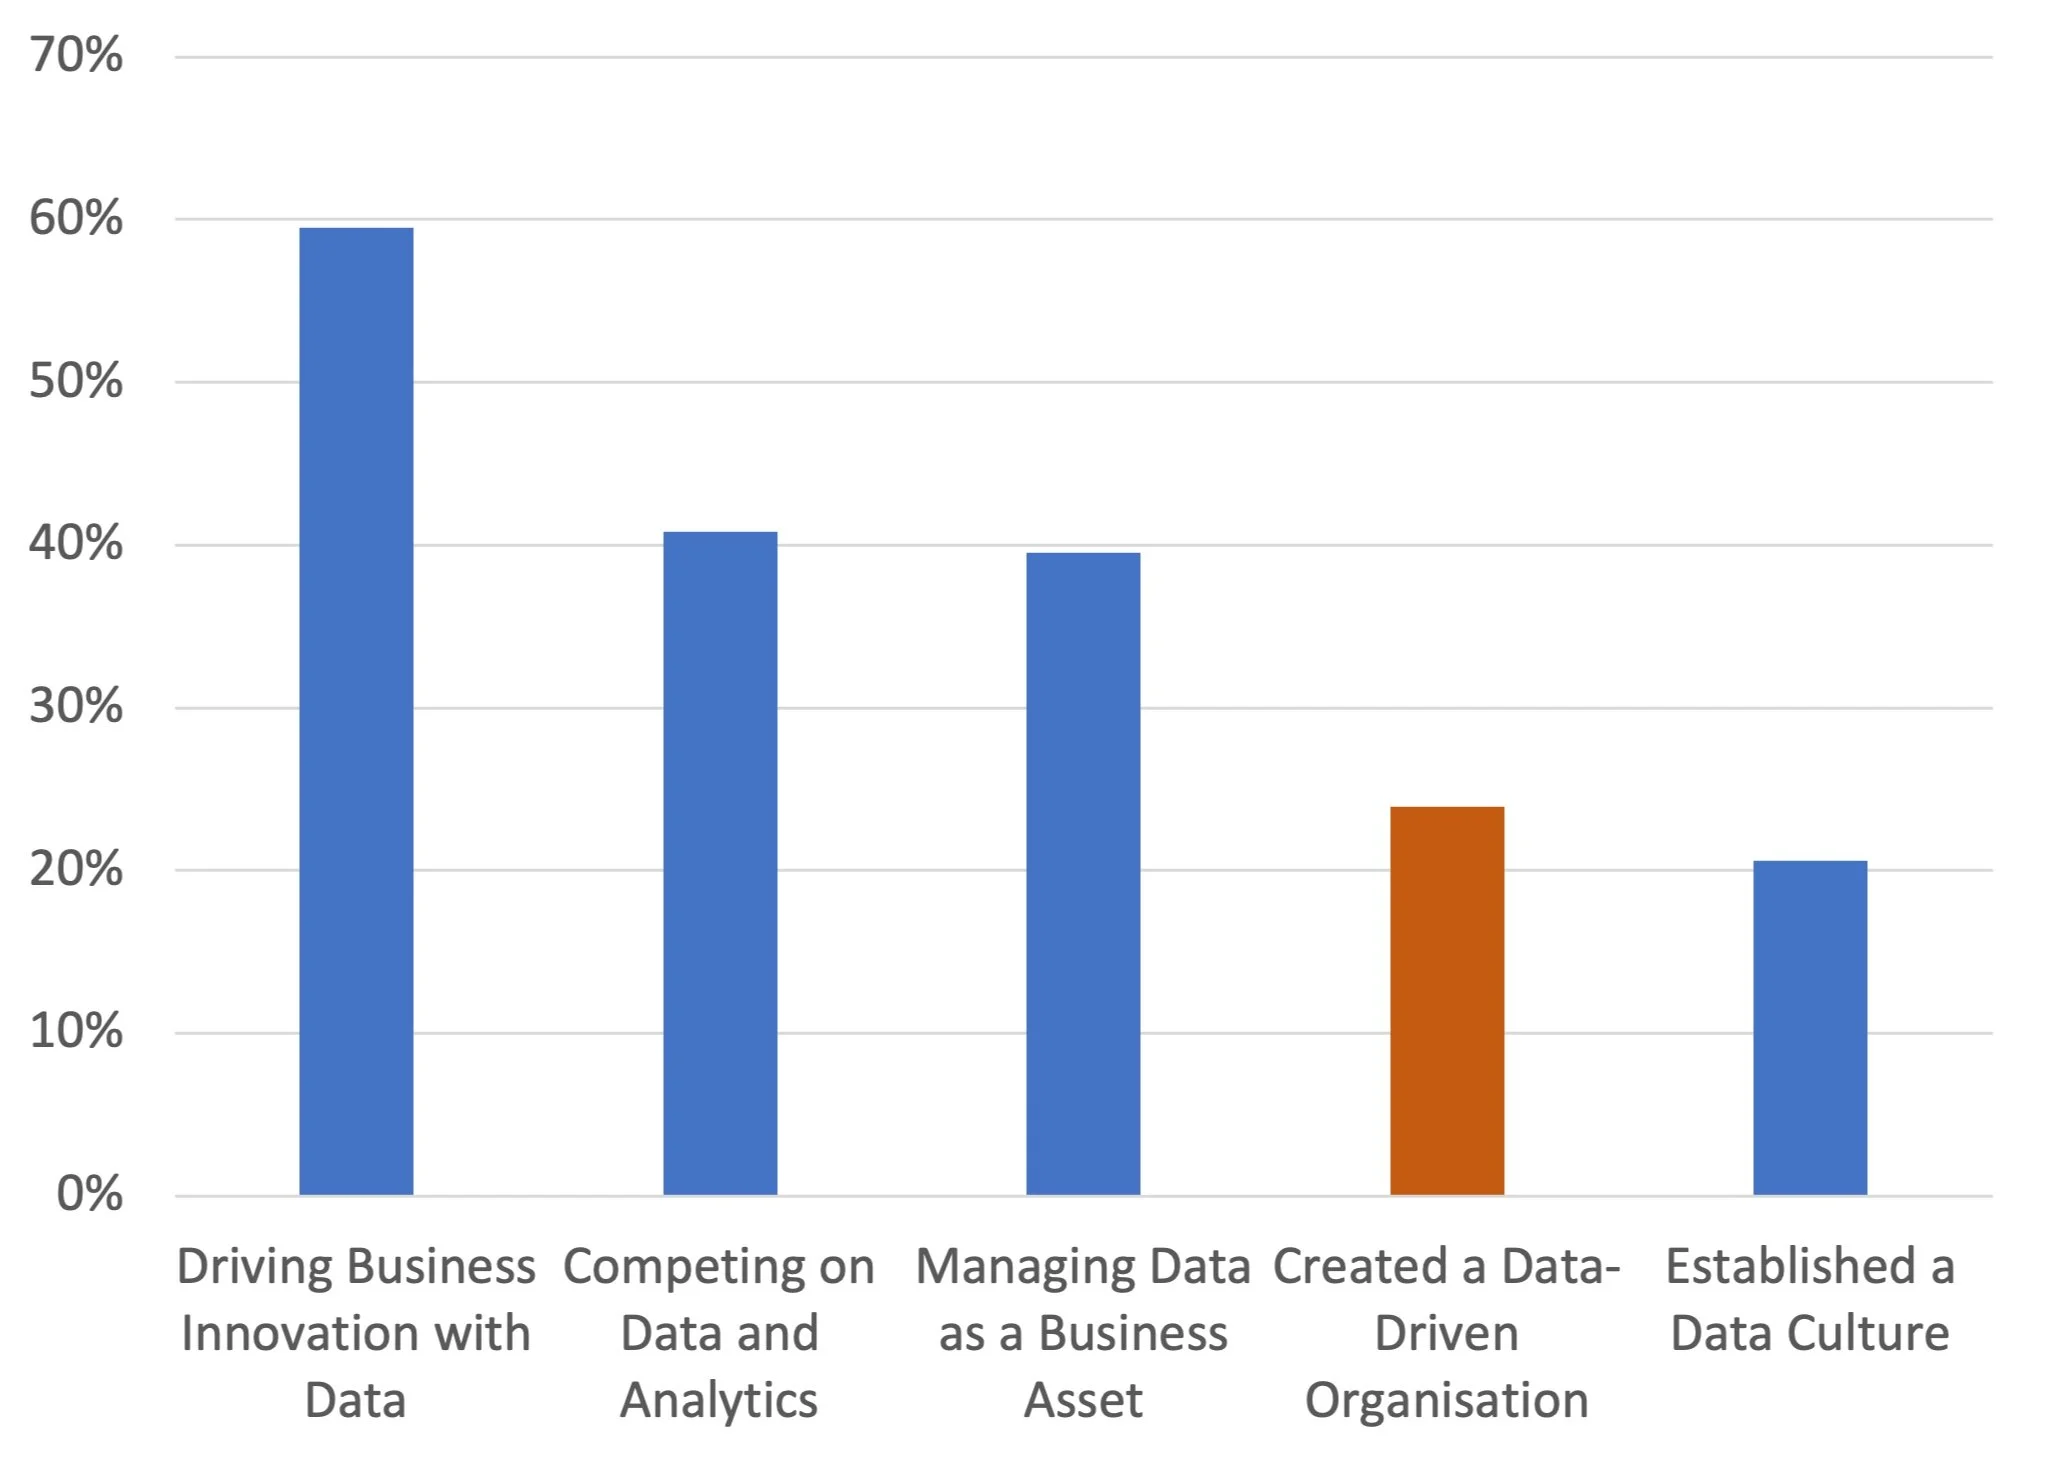
Fewer than a quarter of data executives in leadership positions say their organisation has become data driven.

Some organisations make heavily data-driven decisions because making wrong decisions is very expensive, either because they make a lot of decisions, e.g. banks approving loans, any other organisation approving credit or because the decisions are about very large, non-reversible investments, e.g. oil companies deciding where to drill, FMCG companies deciding what products to make, car companies deciding what cars to make.

Other organisations use data to help them make decisions because of regulatory intervention, e.g. pharmaceutical companies trialling drugs.

Governments use data to help them make decisions about how to spend public money, e.g. in the UK the Public Accounts Committee (a group of MPs from the House of Commons) can request the National Audit Office (an independent public body) investigate anything the government does and check to what extent the public has got good value from the spending. Ministers and senior officials have to explain in public how decisions were taken and how evidence was used to support the decision.

With increasing digitalisation of production facilities, and the workplace in general, more and more data has become available with which to make decisions. The growth in popularity of Six Sigma, Lean and other process improvement methods over the last 20 years has drawn more attention to data analysis where there had not been much before. Now even small start-ups are able to finely tune their business based on tight feedback loops from their website and other systems generating data using off-the-shelf products.

No one is debating that there is a lot of data available, at very low cost, to every organisation.

The challenge is how to get the best value out of it.

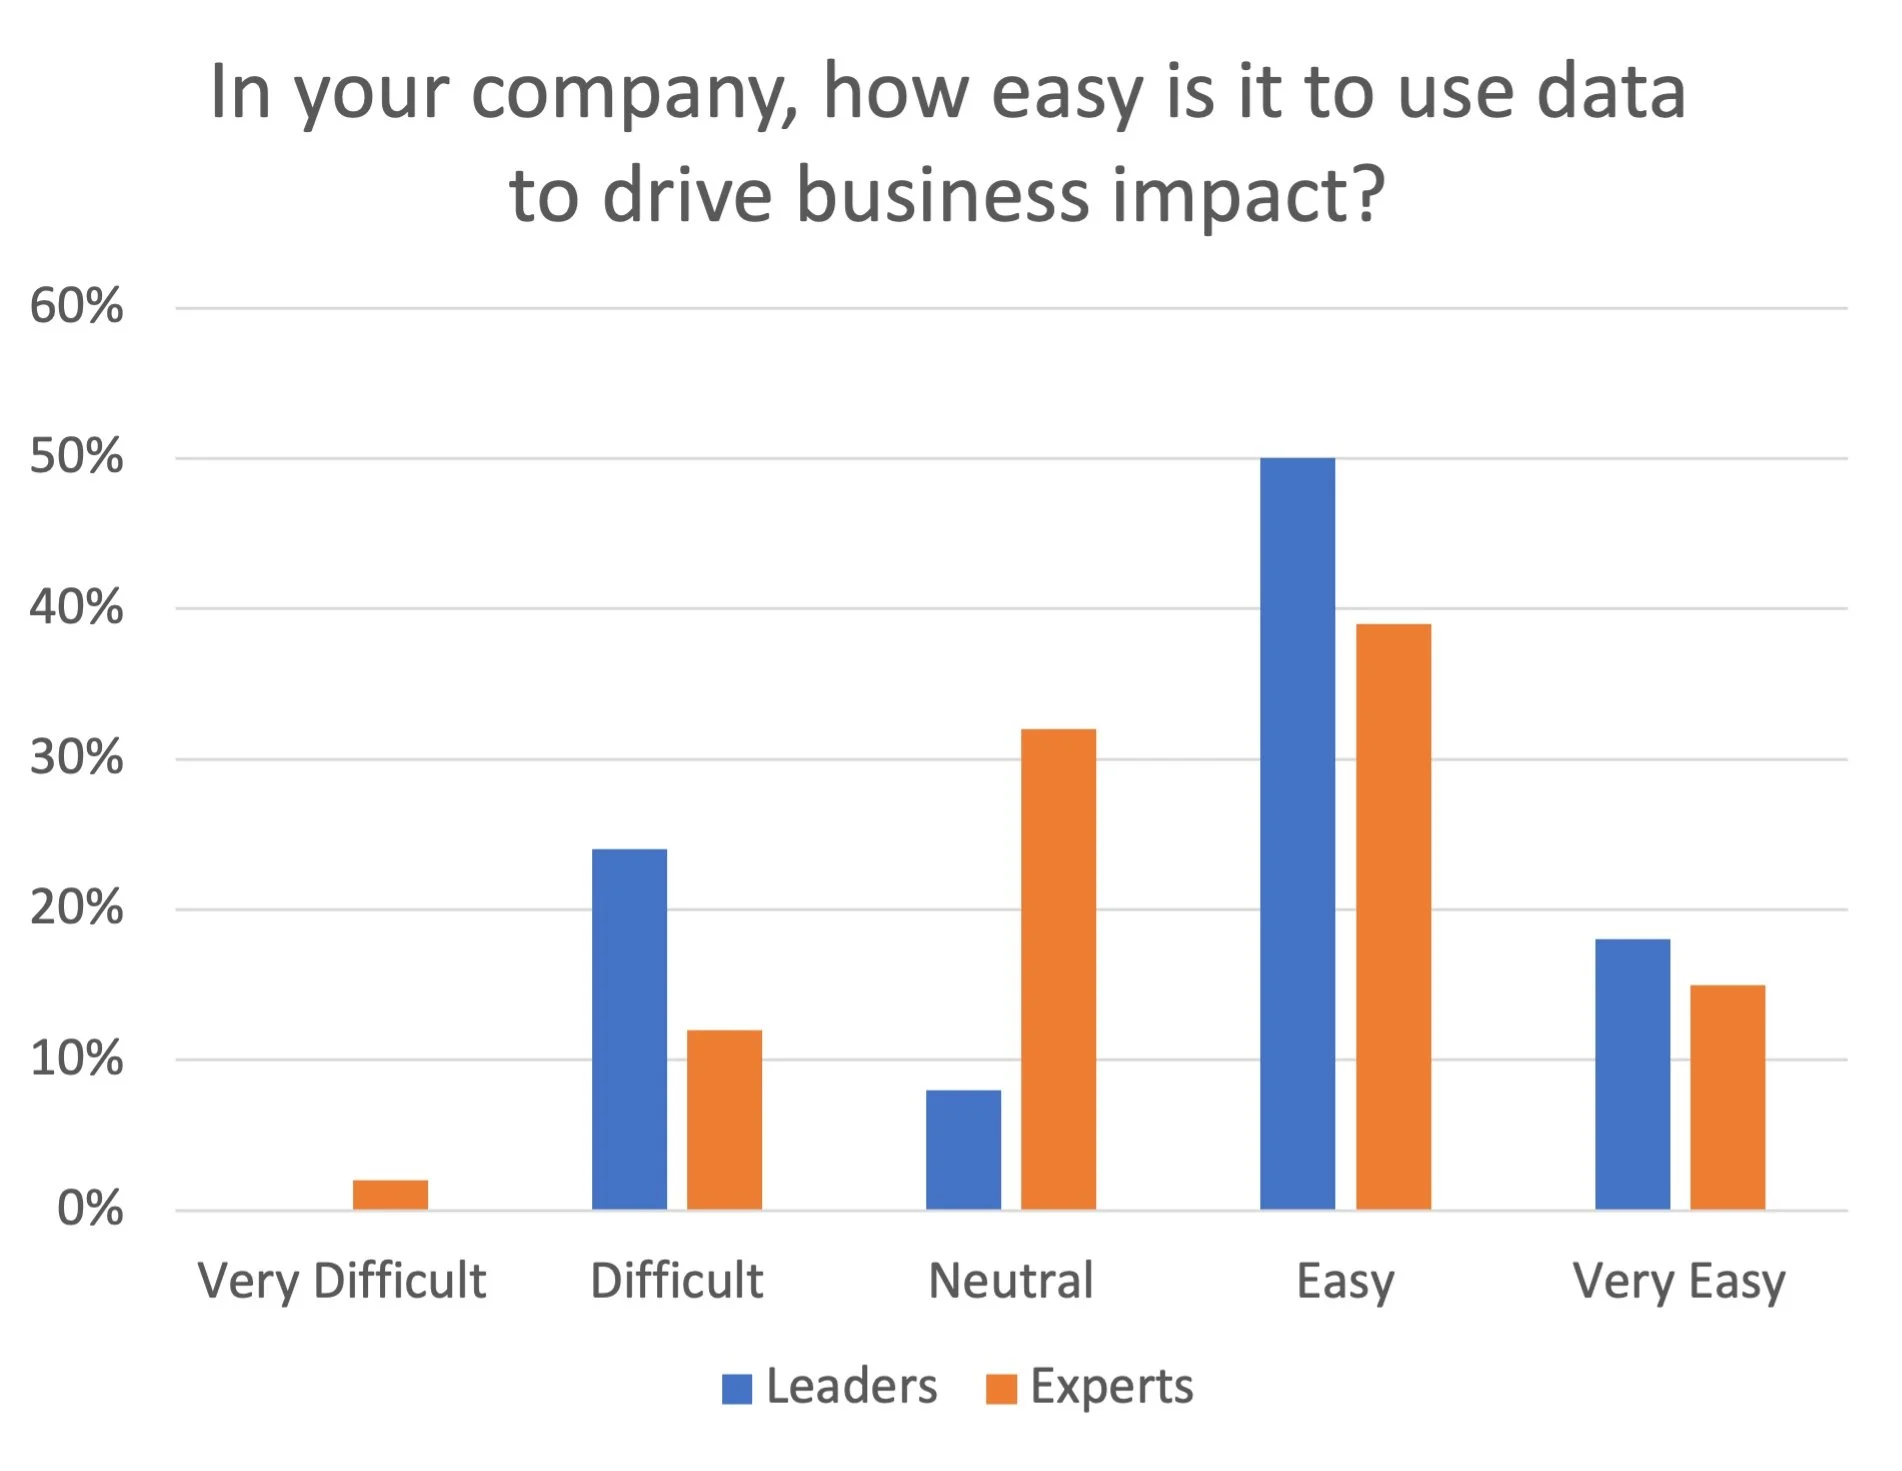
Over a third of Data Leaders and experts think it is not easy to drive business impact with data in their organisation

And Data Experts have an even more pessimistic view than Data Leaders.

Leaders and experts from across the world are all busy proposing solutions to the problem of how to become more data-driven. Your LinkedIn feed is probably full of points of view and articles that are trying to help.

Part of the problem is that becoming more data driven is often seen as a responsibility of the CIO or CTO. There are some solutions which can help but because the issue is bigger than the remit of a CIO or CTO, they cannot solve the problem on their own.

The most common solution

tech / data organisation – “bringing all of our operational, financial, web and CRM data together in a single place will definitely give a small bump in operating margin, right?“

With the growing volumes of data has come an industry supporting its organisation. From data ski lodges to streaming data from your CEO’s brainwaves, there are an infinite range of things you can do to better capture and organise your data.

However technology on its own will not make you more data driven in your decision-making. Having incredible volumes of data sat in AWS and growing by zetabytes every second does not provide anyone in the company with more evidence about what is the best choice to make. It does not help a sales manager decide where to focus their time. It does not help a procurement team reduce their supply chain risk.

Static data does not answer your questions.

data scientists (and how they are organised) – “hiring more nerds will increase operating margin by at least 3%, right?“

Since Big Data and Machine Learning became popular earnings call bingo topics in the early 2010s, hiring STEM Phds to build random boosted binomial tree networks has been become a common strategy to try and demonstrate value from data.

Until recently, some of the most valuable applications of machine learning were out of reach because regulations stipulated that only older, more transparent approaches were allowed, e.g. banks still choose to use binomial logit models for credit approvals because they are very easy to audit compared to other more sophisticated machine learning frameworks.

Nevertheless, predictive analytics has become an important topic in many industries: predicting failure rates in physical systems, predicting which customers are likely to leave.

While there are many valuable applications of predictive analytics, the excitement around it has also crowded out more fundamental, less exciting analysis, like understanding variation in an outcome and what causes it.

The tendency of data scientists to sit under the CTO in many organisations also means that their priorities are aligned with more technological objectives than business-related: “I’ve just invested a lot of money in system x, now I’d better get some data scientists to work on the data to demonstrate system x is good value”.

This ends up looking at things backwards – the most valuable things a data scientist can do for your organisation is not necessarily a subtask on the to do list of the CTO. At the very least, the most important conversations for a data scientist to be part of are not with data engineers and developers, but with people in other parts of the business who can see where impact is needed.

data democratisation – “giving people access to a hundred different dashboards that they can slice and dice will increase operating margin by at least 15%, right?“

74%

Proportion of employees reporting feeling overwhelmed or unhappy when working with data

Source: Accenture/Qlik: The Human Impact of Data Literacy

A more recent theme in discussions about improving decision-making is data democratisation. This is the idea that many employees are constrained in their effectiveness because they do not have enough information at their fingertips, and the solution is to give them more control over what data they can access and how they can access it: interactive dashboards with lots of filters, connected to live data, rather than static pdfs or excel tables. Like the other proposed solutions, this one is not an inherently bad idea. However, it assumes that people have a good understanding of the problem they are trying to solve, and its strategic importance. It also assumes people have the skills and knowledge to navigate the data available to them and use it appropriately to answer their question. This is a very strong assumption.

data literacy – “teaching everyone about all our data sources and why pie charts are evil will surely double our operating margin, right?“

Data literacy is the solution to the issue with data democratisation of people saying they are overwhelmed by the data available to them. It aims to give them the skills to handle it and process it into something they can use to make a decision. Many of the features of data literacy training programmes are similar to what is taught in Lean and Six Sigma, although with less of a process improvement focus. This kind of training is clearly not a waste of money, but it doesn’t necessarily address the problem of business performance because it doesn’t teach people about the kind of questions they should be asking in the first place. This is not something you can learn from Jordan Morrow, nor is it something you can buy from Udemy.

None of these solutions are bad, but they also won’t bring your organisation closer to data driven decision-making. Why?

  • Firstly, these solutions are nugatory and only address one part of a what is a complex and systemic issue. None of the solutions address how data is used in decision-making. None of them address the question of what data, tools, models and graphs are best suited to addressing a particular kind of decision in your organisation.

  • Secondly, they are non-strategic. In particular, tech/data organisation, democratisation and data literacy programmes tend to take a scatter-gun approach, focussing on high volume. Data-driven decision making is partly a cultural challenge and as with other cultural challenges, change needs to begin at the top. Why focus data literacy programmes on more junior employees, when the board and senior executives are the ones making the most expensive decisions?

  • Thirdly, the solutions are not value focussed. None of them start with the business’ goals in mind. Without this, money and time are wasted on endeavours that may deliver some value, but are not necessarily delivering value to a strategic goal.

So what is the solution?

Keep reading.

A firm view on resources

https://www.economist.com/finance-and-economics/2023/04/04/why-economics-does-not-understand-business

When I was first poking my nose into economics as a teenager I came across the famous definition that it is the study of allocating finite resources. Since then I’ve worked in government, at a regulator and for multiple companies, and I can stand very firmly behind the opinion that academic economics has a very poor understanding of how resources are allocated within a commercial organisation, and how decisions are made.

However, there is a field that has been developing quietly over the past twenty or so years that seeks to understand firms as a collection of resources and how these resources can be optimally combined to improve firm performance.

My first encounter with it was while studying the relationship between investment in ICT and productivity. A number of studies looked at complementary business changes/characteristics alongside the introduction of things like email, e.g. email had more of an impact on organisations that had a flatter structure. Lowering the costs to communication makes more of an impact when you can be more effective by communicating with more people.

Now everyone wants to be data driven, but being more data driven is so much more complex than dashboards and data literacy classes. I am looking at how organisations can improve their decision-making by not only investing in fancy tech and data infrastructure, but changing how they make decisions and investing in organisational learning. It is not a simple story, and every organisation has different challenges, but there are common themes that can be used to help drive improvement.

Maybe there will be studies we can publish in the future, and someone can revisit this Economist article.

A letter to job applicants everywhere

Over my career I have reviewed a lot of CVs and done a lot of interview panels. After some recruitment activity last year I wanted to share some thoughts with anyone who may ever apply for a job:

Dear Job Applicants,

If you think you are qualified for a role and want to improve your chances of success (at least with hiring managers who share my view of the world!) then here are some tips based on my own experience.

Talk about the impact you had. I want to hire someone who is going to have an impact on my organisation. The best way to find this is by hiring people who have had an impact before. You can do lots of interesting things but if it doesn’t deliver value of some kind then you’ve been doing a hobby, not work.

Think about why you want to work for a company. When you commit to a relationship with another human being you usually can articulate why you want to spend more time with them, and maybe make big financial commitments together, and maybe have children. Working for an organisation is not as big of a commitment, but you should be able to articulate why you want to enter in to the relationship.

Make it easy for the interviewer to assess you. Listen to the question. If the interviewer is trying to get you to talk about a specific competence then use the STAR method. If the company publishes information about its values or competency framework then use this in your preparation. Prepare STAR type answers based on the values/competencies. This will also help you understand whether this job really is for you. If you can’t find any examples from your recent career where you have demonstrated the competencies/values and made an impact then maybe you shouldn’t be applying for a role there…

I am not hiring the team you worked with. I’m interested in hiring you. Therefore, do not answer my questions using “we did”, “we asked”, “we prepared”. What did YOU do?

You are highly likely to get screened out early on if you do not tailor your cover letter in any way. No one likes to go on a date where your partner has five other people sitting at other tables in the cafe. It’s the same with work – demonstrate some focus.

Finally, don’t forget to think about your values and objectives and what questions you should ask to find out if the organisation is aligned to you. Not only does this help you understand if the role is right for you, but also it demonstrates you are conscientious and thoughtful.

Good luck with your applications.

Kind Regards,

A Tired Hiring Manager

Invest in your staff to get the most out of your IT – evidence from the Netherlands.

Improvements in labour productivity are the primary route to increasing the long-run economic wealth of a population, so any evidence about how to achieve improvements is always welcome.

This very well written paper from the OECD looks at a very well-worn topic on productivity – how it is related to IT and digital technologies. Since the mid 2000s there has been a long running debate about how much of a contribution IT investment has made. For the USA and other OECD economies, it appeared like the initial benefits of the 90s had stopped and failed to return.

When I was studying this topic about 10 years ago initial studies (including my own) made clear that investment in organisational capital was needed to fully benefit from investment in new software and systems: essentially, adopting new software doesn’t necessarily make a company more productive at something without staff learning new skills, and, crucially the company adopting new processes.

For example, investment in email and digital communication systems gives a company much more productivity benefit if combined with moving to a flatter structure where staff have more autonomy.

This study shows that in the Netherlands there has been a significant productivity benefit to service sector firms from increasing the digital skills of their workforce. Furthermore, less productive firms have seen a significant productivity improvement from investing in software.

As ever there are some limitations to the econometric methods used here, in particular the authors have to assume that all firms are ‘small’ in their sector and there are no firms that are technologically dominant. Their methodology also doesn’t account for firms in the Netherlands acquiring productivity-improving technologies from outside the country. Given the number of multinationals operating here, and the openness of the country this is quite a big issue.

However, these are things that can be improved with further work. The main contribution of this article is validating with quantitative evidence the intuition that you need to improve your workforce’s digital skills in order to leverage the productivity benefits of IT investment.

The dangers of old people

Last week I wrote about how it’s ok for governments to spend more than their tax take when the economy is depressed.  This week I’m going to show that while additional spending can be helpful to kick-starting the economy, there are good things to spend the money on, and there are less good things.

The current government made a big fuss in 2010 about how it was going to protect the incomes of pensioners by guaranteeing to increase the Basic State Pension by the highest of inflation (the Retail Prices Index), average earnings, or 2.5%.  This might seem like a nice policy, something to make us all feel warm and fuzzy about making sure that pensions can take care of themselves.

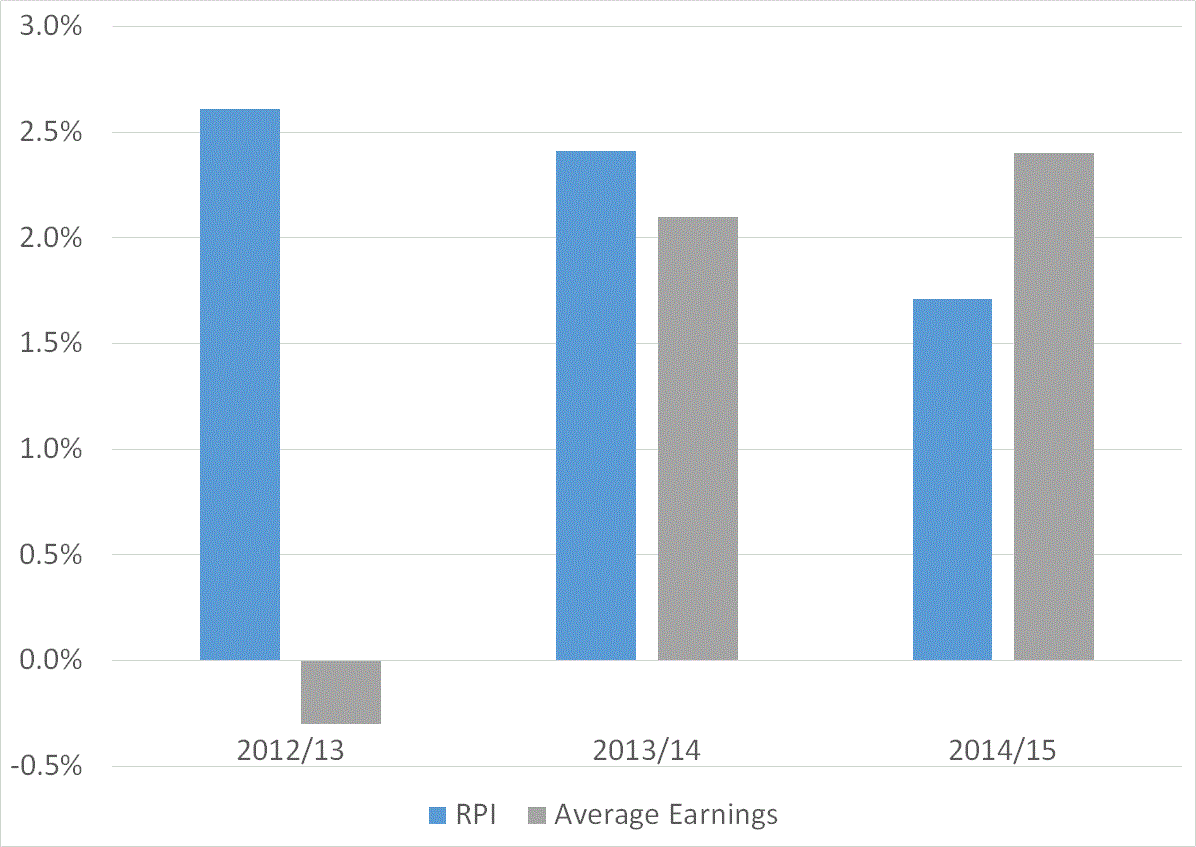
However, this policy has been incredibly expensive.  In 2012/13 RPI inflation was 2.6% and average earnings fell by 0.3%, so all the oldsters got an additional 2.6%.  The total spend on the Basic State Pension in 2011/12 was £74.2bn.  Therefore increasing the pension rate by 2.6% increased the spend on State Pension by £1.9bn.  The value of the increase above average earnings (2.6% – -0.3%) was worth around a quarter of a billion pounds.

blog_graph_pensions

Since then each year pensions have got another 2.5%.  Boom – another cool two billion to spend on cruises and Werthers Originals. Average earnings have picked up but continue to grow at less than 2.5%.

The problem with this is that there are many, many more things that government could spend money on which would do more good for the country than shovelling cash into the pockets of old people.  For example, the UK Apprenticeships programme has been successfully providing young people with skills that employers explicitly want.  It has been evaluated as adding £18 to the economy for every pound of government money spend on it.  That is a return of 1800%.  Not bad Vince. Not bad.

You might be asking what is the return on spending on pensions.  Zilch.  A pound spent on pensions is merely moving money from one pocket to another.

In 2013/14 the total spend on all Enterprise and Skills programmes in the UK was £4bn.  The increase in spending on State Pension was half of the total spend on Enterprise and Skills.

If just a quarter of that increase were used for Apprenticeships that would mean the economy would not be only £250m better off, it would be £4.5bn better off.

Crappy spending decisions like the Triple Lock is why governments that listen disproportionately to old people are not good economic stewards.

Young people: Vote!

Older people, if you want your children and grandchildren to live in a wealthy society, don’t listen to the siren calls of bigger cash transfers. (and tell your children and grandchildren to vote).