Author Archives: Jack Gannaway

The electric vehicle transition is reshaping procurement pay in the West Midlands

Buyers and procurement officers in the West Midlands were the lowest paid in the country for their profession in 2024. By 2025, they were second only to London. The shift reflects something structural happening to the region’s labour market.


Few job titles sound less exciting than “buyer and procurement officer.” But the pay data for this occupation in 2025 tells an unexpectedly sharp story about what the transition to electric vehicles is doing to the West Midlands workforce.

Median annual pay for procurement professionals in the West Midlands rose from £32,292 to £40,824 between 2024 and 2025, an increase of 26%. Most other regions saw increases of 1-9% or stayed flat. Scotland and the North West barely moved.

Article content

A region built on supply chains

The West Midlands accounts for around 32% of UK automotive employment and is home to JLR, Stellantis, and a dense network of tier-1 and tier-2 suppliers. For decades that concentration made the region a natural home for procurement professionals who understood how automotive supply chains worked.

The shift to electric vehicles is changing the skills that concentration demands. New supply chains for battery materials, power electronics, and new categories of component require procurement professionals who can manage entirely different supplier relationships, often with overseas partners, and across materials with volatile pricing. That kind of specialist capability is in short supply nationally — and disproportionately in demand in the West Midlands.

Public investment is amplifying that demand. A £12.5m Supply Chain Transition Programme launched in 2025 specifically targets diversification into EV, battery, aerospace, and medtech supply chains. A £15m manufacturing transformation fund is also active. Regional manufacturing output is already more than 10% above 2019 levels, with 9,000 jobs added since 2023.

From lowest to near the top

In 2024, a procurement professional in the West Midlands earned roughly £4,000 less per year than one in London and around £5,000 less than one in the East Midlands. By 2025, the West Midlands had overtaken the East Midlands entirely and was within £800 of London’s median.

That kind of catch-up from a low base does not happen through routine salary reviews. It requires genuine demand pressure: employers competing for a limited pool of people with the right skills, in a region where those skills are suddenly more valuable than they used to be.

Reed’s 2025 procurement salary guide specifically identifies the West Midlands as one of theregions where procurement and supply chain salaries have increased the most, attributing it to the strong performance of transport and logistics firms — which in this region means, in practice, the automotive transition.

Why other regions stayed flat

London and the South East were already high-cost environments for procurement talent, so additional demand produces smaller percentage moves. Yorkshire, Scotland, and the North West have less manufacturing concentration and fewer large-scale EV transition anchors in their supplier base. There is no equivalent structural driver pushing procurement pay sharply upward in those regions right now.


Why radiographer pay surged in the West Midlands and fell in London

The same occupation, the same national pay scale, but very different regional stories. New data from Wage Wizard reveals what’s really happening to radiographer pay across the UK.

NHS radiographers work to a national pay scale. Agenda for Change rates are set centrally, apply uniformly across England, and moved by 5.5% in 2024-25. So why does the latest ONS earnings data show median annual pay for radiographers rising by 25% in the West Midlands while falling by 11% in London?

The answer tells you more about how the NHS is managing a workforce crisis than about pay rises but it is a genuinely important story about what is happening to radiography services across the country.

The West Midlands: a diagnostic centre building boom

The West Midlands has seen one of the most intensive expansions of Community Diagnostic Centres anywhere in England. Birmingham’s first CDC opened in 2024 at Washwood Heath; a North Solihull centre followed in spring 2025; a South Birmingham centre was announced for summer 2025. The West Midlands Imaging Network now spans 15 NHS trusts serving 6.7 million patients, and Midlands CDCs have collectively delivered nearly 1.5 million diagnostic tests since mid-2024.

Building that capacity quickly, in a profession with a 13% national vacancy rate, means competing hard for experienced staff. CDCs disproportionately recruit Band 6 and Band 7 radiographers: the senior practitioners who can work more independently and handle the volume these facilities are designed to deliver. In 2024, the West Midlands ASHE sample for this occupation was weighted toward entry-level and mid-grade workers. By 2025, a significant cohort of more senior, higher-paid staff had joined the regional workforce.

The result: median annual pay moving from £34,788 to £43,629 not because anyone received a 25% pay rise, but because the composition of who is working in the region shifted sharply upward in seniority.

That is a meaningful distinction. But it is also a real signal: the West Midlands is now a materially different labour market for experienced radiographers than it was twelve months ago.

London: the agency crackdown bites

London’s story runs in the opposite direction and has a different structural cause.

In 2024, London’s median radiographer pay of £53,944 sat well above the Agenda for Change Band 7 maximum of around £48,000. That premium reflects the high proportion of agency and bank staff captured in the London ASHE sample radiographers working at rates that can reach two to three times standard NHS pay. London NHS trusts, under persistent staffing pressure, had been among the heaviest users of temporary radiology staff.

In late 2024, that changed. The Health Secretary mandated a system-wide freeze on agency spending; NHS England cut total agency spend by nearly £1 billion in 2024-25, a reduction of around 30%. Radiology where the NHS had been spending an estimated £325 million per year on temporary staff, up 24% year-on-year was a prime target.

By April 2025, when ASHE data is collected, the high-pay agency cohort that had inflated London’s median was significantly smaller. The median fell to £47,855, much closer to the standard AfC Band 6-7 range, not because any radiographer took a pay cut, but because fewer high-cost temporary workers were captured in the data.

What the data actually shows

The chart below shows median annual pay for medical radiographers by region in 2024 and 2025, for the eight regions with sufficient data quality to report reliably.

Article content

The broad picture is one of convergence: the two lowest-paid regions in 2024 (West Midlands, £34,788; East Midlands, £36,413) have moved significantly toward the national centre of gravity. The outlier at the top (London, £53,944) has come down. Most other regions remained broadly stable.

What this means for radiographers and patients

For radiographers, the regional picture has become more equal but also more complex. The West Midlands is clearly hiring, and hiring at senior grades: it is potentially a good moment to be an experienced practitioner in that market. London’s apparent pay premium has narrowed considerably, though this reflects a reduction in lucrative agency work rather than a change in permanent salaries.

For patients, the CDC expansion in the West Midlands represents a genuine step-change in imaging capacity. The question is whether the workforce to sustain it is there: with a 13% national vacancy rate and an agency crackdown limiting the flexibility that trusts have relied on, the pressure on permanent radiography staff is not going away.

Explore pay for radiographers and hundreds of other occupations across every UK region at Wage Wizard

Analytics Innovation – are you working with AI yet?

In my previous post I discussed how common approaches to getting more impact from data will not on their own achieve a great deal, apart from increasing your costs. Here I will discuss a better way to look at the problem.

As with any business problem, it pays to start with your strategic goals – what hard things are you trying to achieve to deliver value for your customers, protect your business from competitors and return value to your owners? When you have a good understanding of this it becomes much easier to think about what you need to do with your data to achieve these goals.

The Analytics Impact Hierarchy

By starting with strategic goals, it becomes clearer what you need to know, and what steps you need to take to get there. This strategic goal is the goal of your innovation: you are trying to use analytics to developing new knowledge about your problem. This new knowledge will help you unlock your goal.

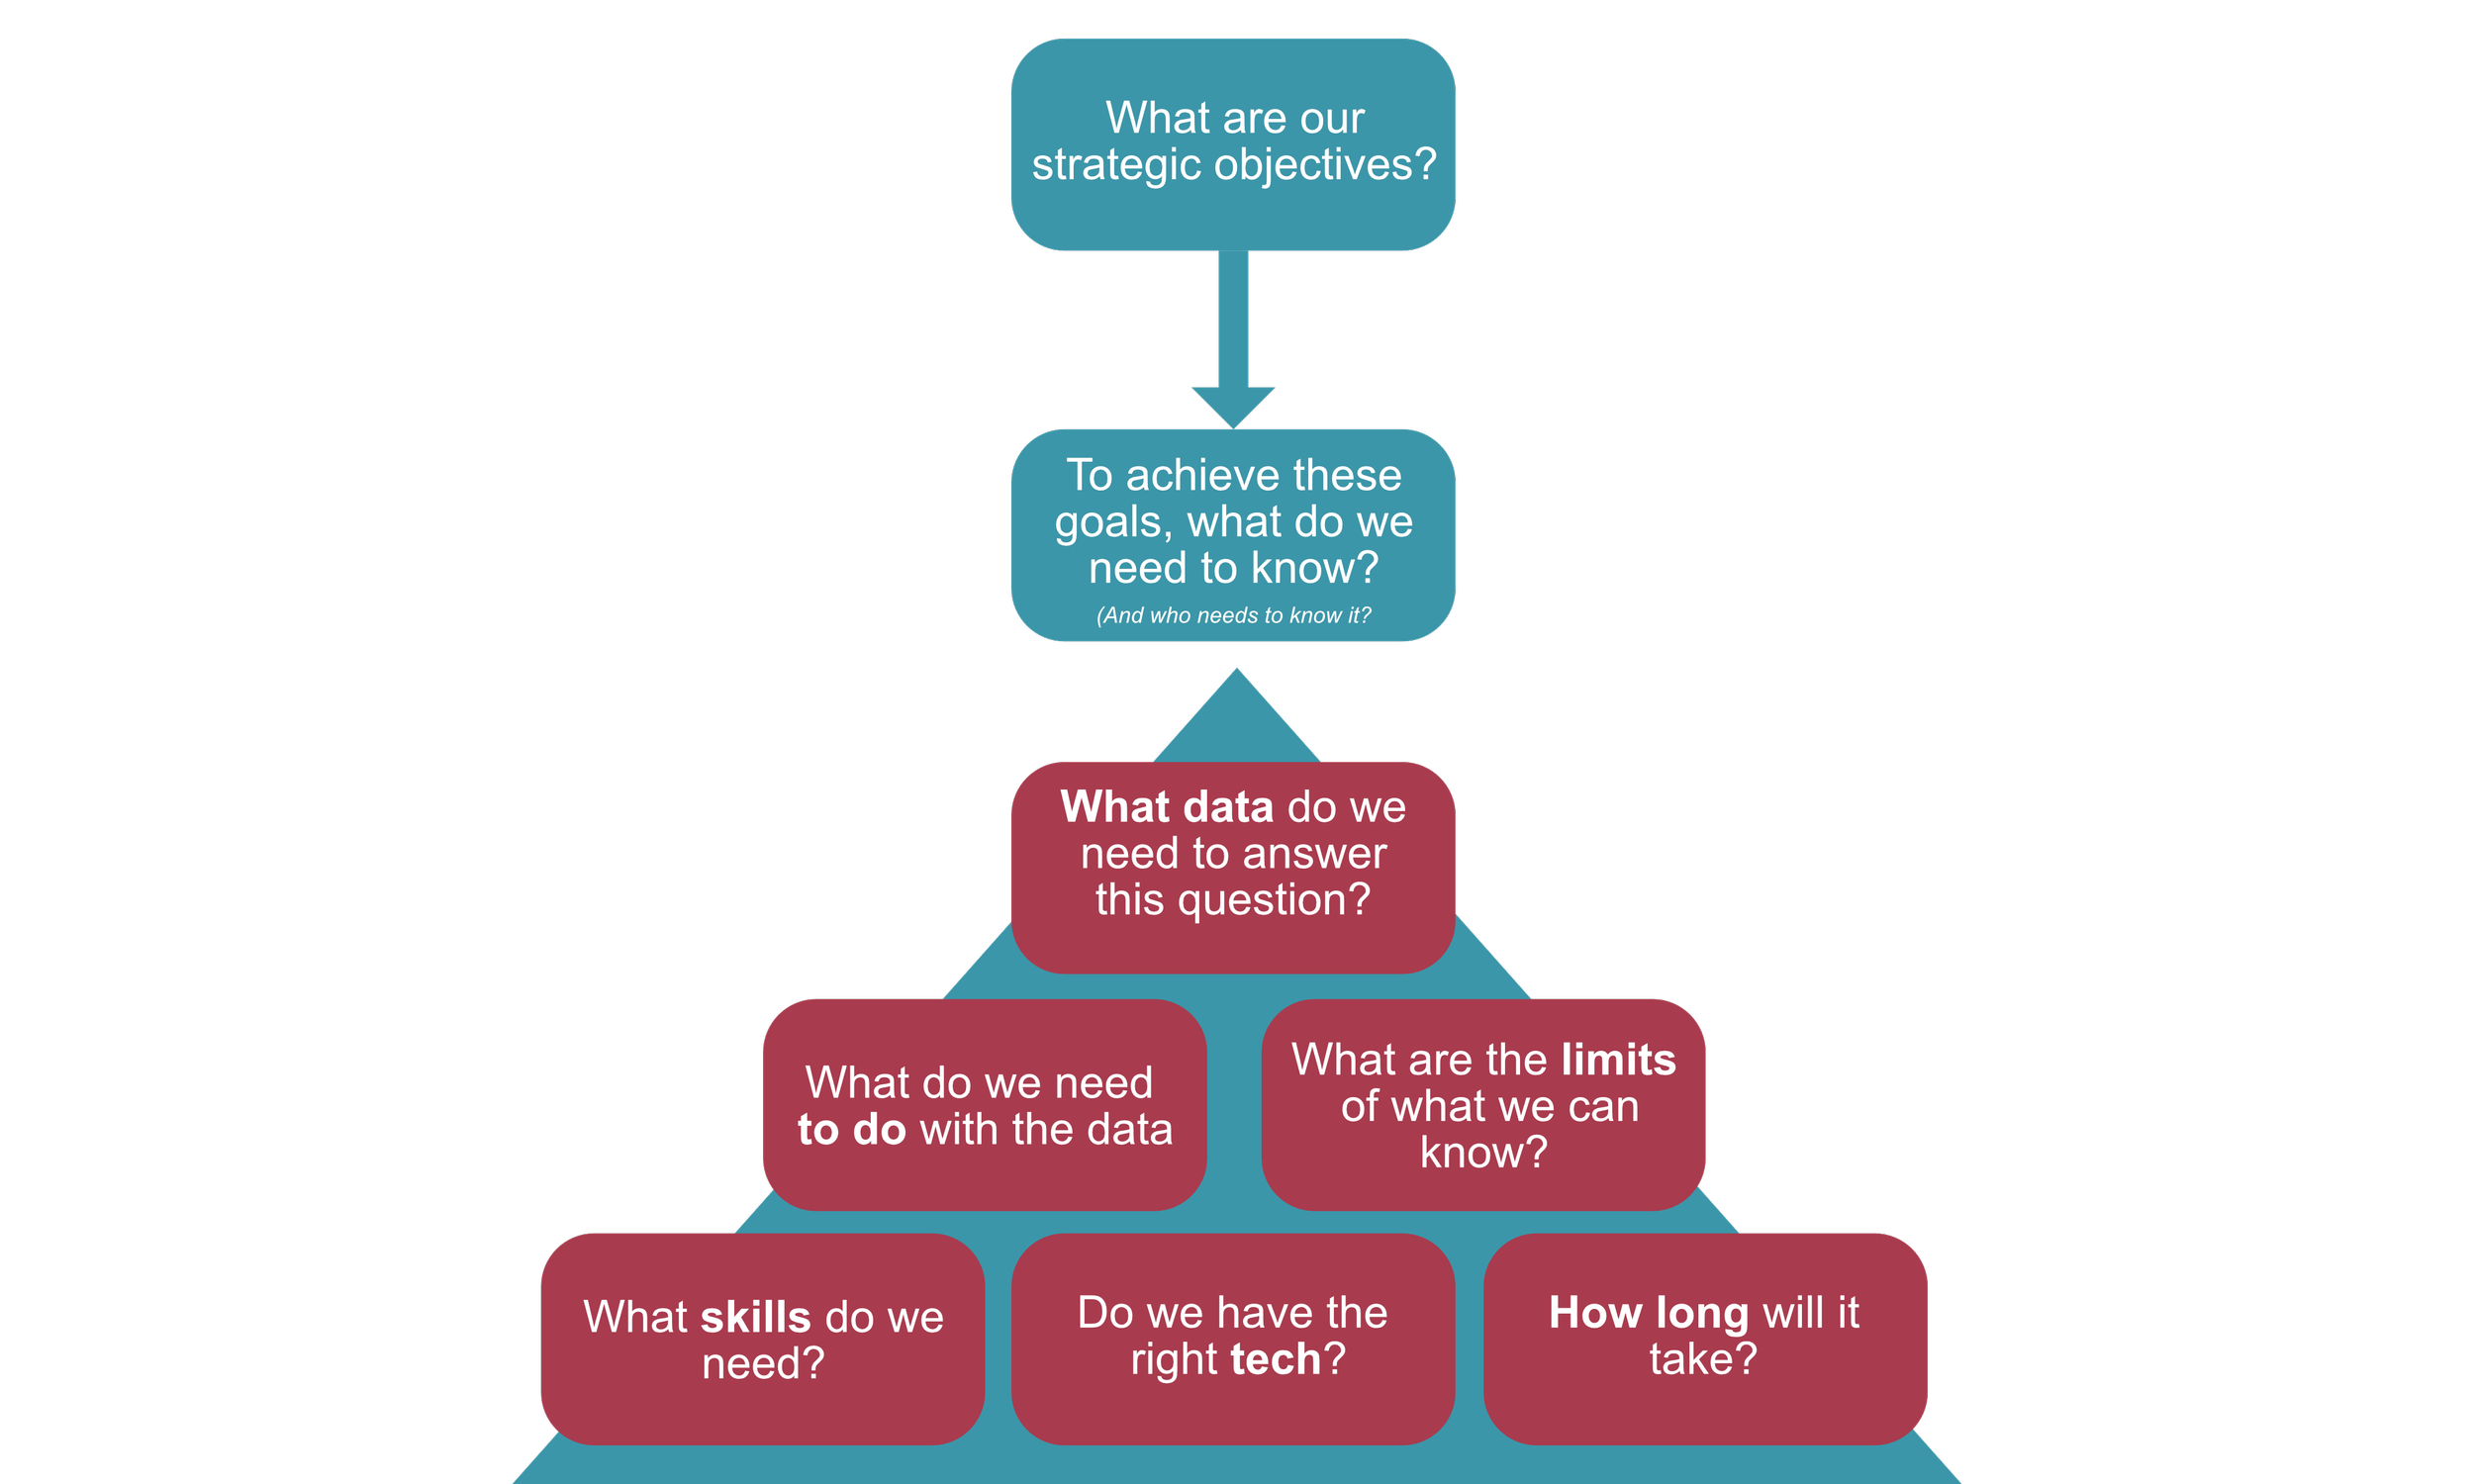
The five questions in the hierarchy start to build the plan for how you are going to develop this innovative knowledge. By answering each one you start to build a picture of how you can get more value out of your data by unlocking this goal.

The questions are arranged in descending order of importance – there is no equality here! Before going any further you need to answer the question what data do you need to answer your questions. If this data is unobtainable then you might need to revise your questions, or even your goal.

Once you know what data you need you can start to look at what you need to do with it and. to what extent it will be possible to answer your questions. For example, if you are trying to build a forecast but you don’t have much historical data then you are going to have to compromise on the precision of your forecast.

Only after looking at these three topics do we get to the more practical topics of skills and technology, and finally timing.

Looking at the problem from the perspective of these five questions is helpful for planning out how to achieve a single goal one time but it doesn’t help you build an organisation that can do analytics innovation again and again in a lean and efficient way.

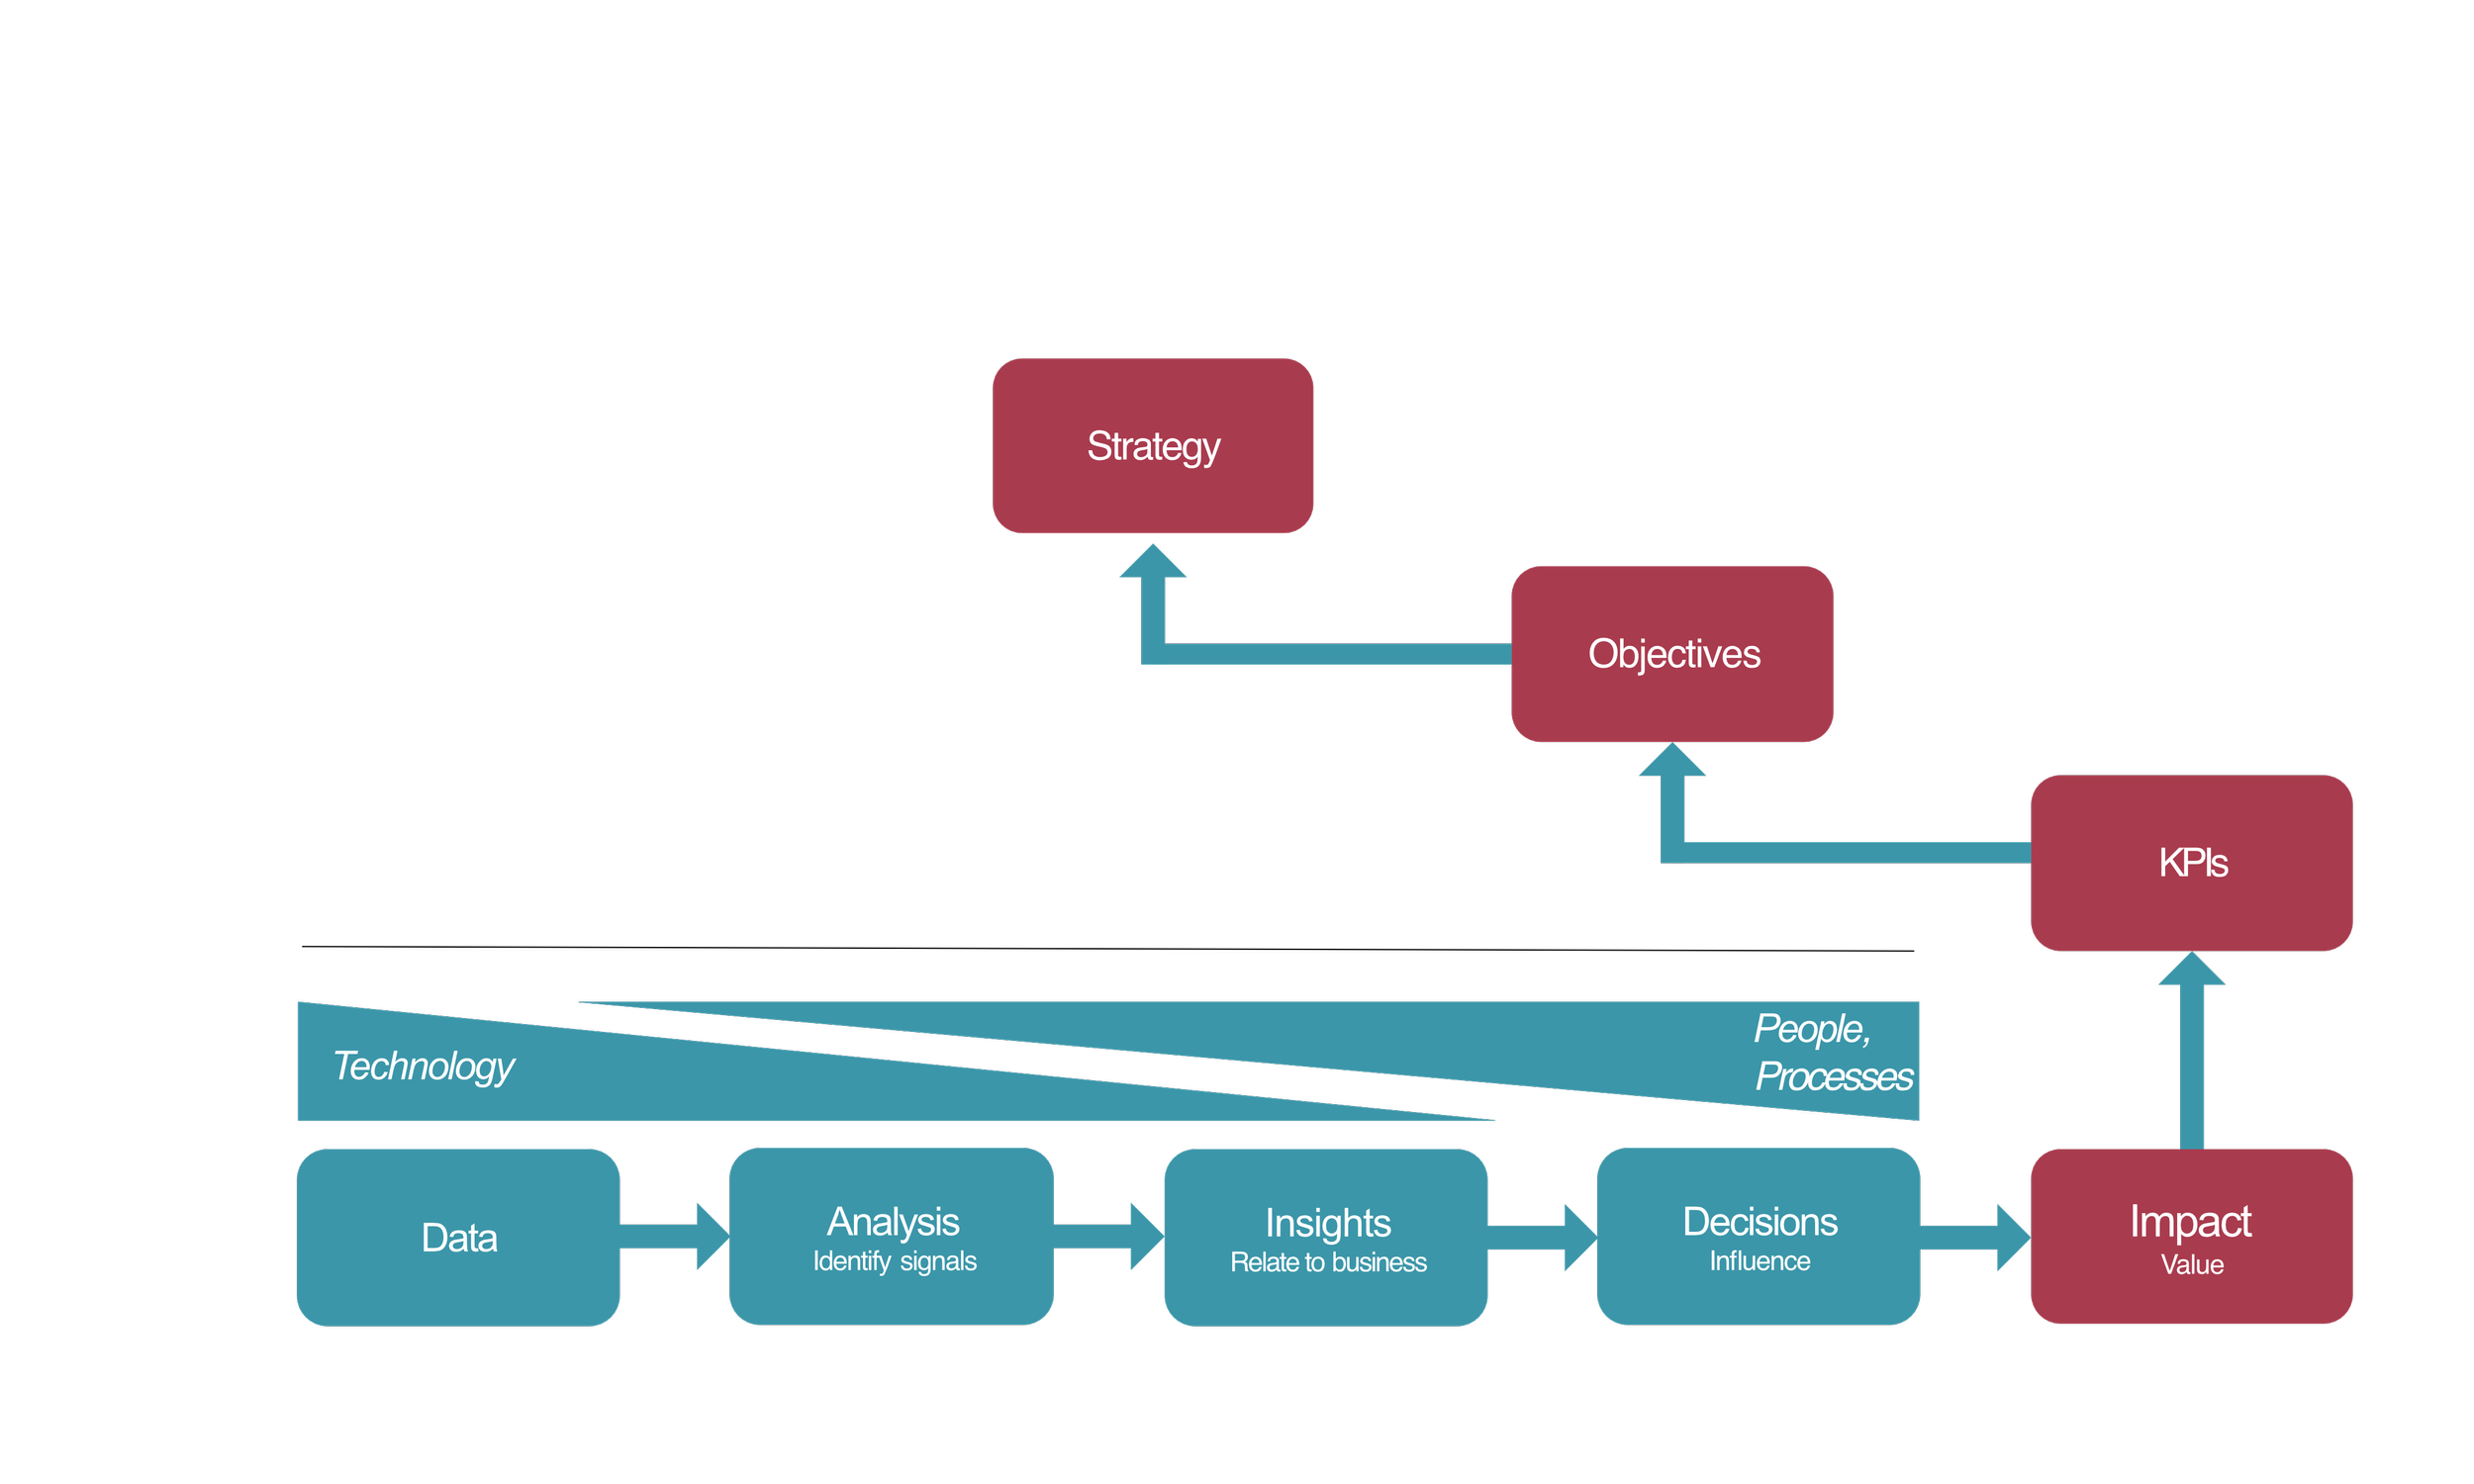
Organisation resources need to work together to generate value

A key part of delivering analytics innovation efficiently is having resources that are not just good on their own but work well together. Data driven organisations have this kind of system embedded throughout, across every function, and at every level.

It is not only about technology, and it is not only about culture.

It is about multiple types of resource working together

But why are so many organisations struggling?

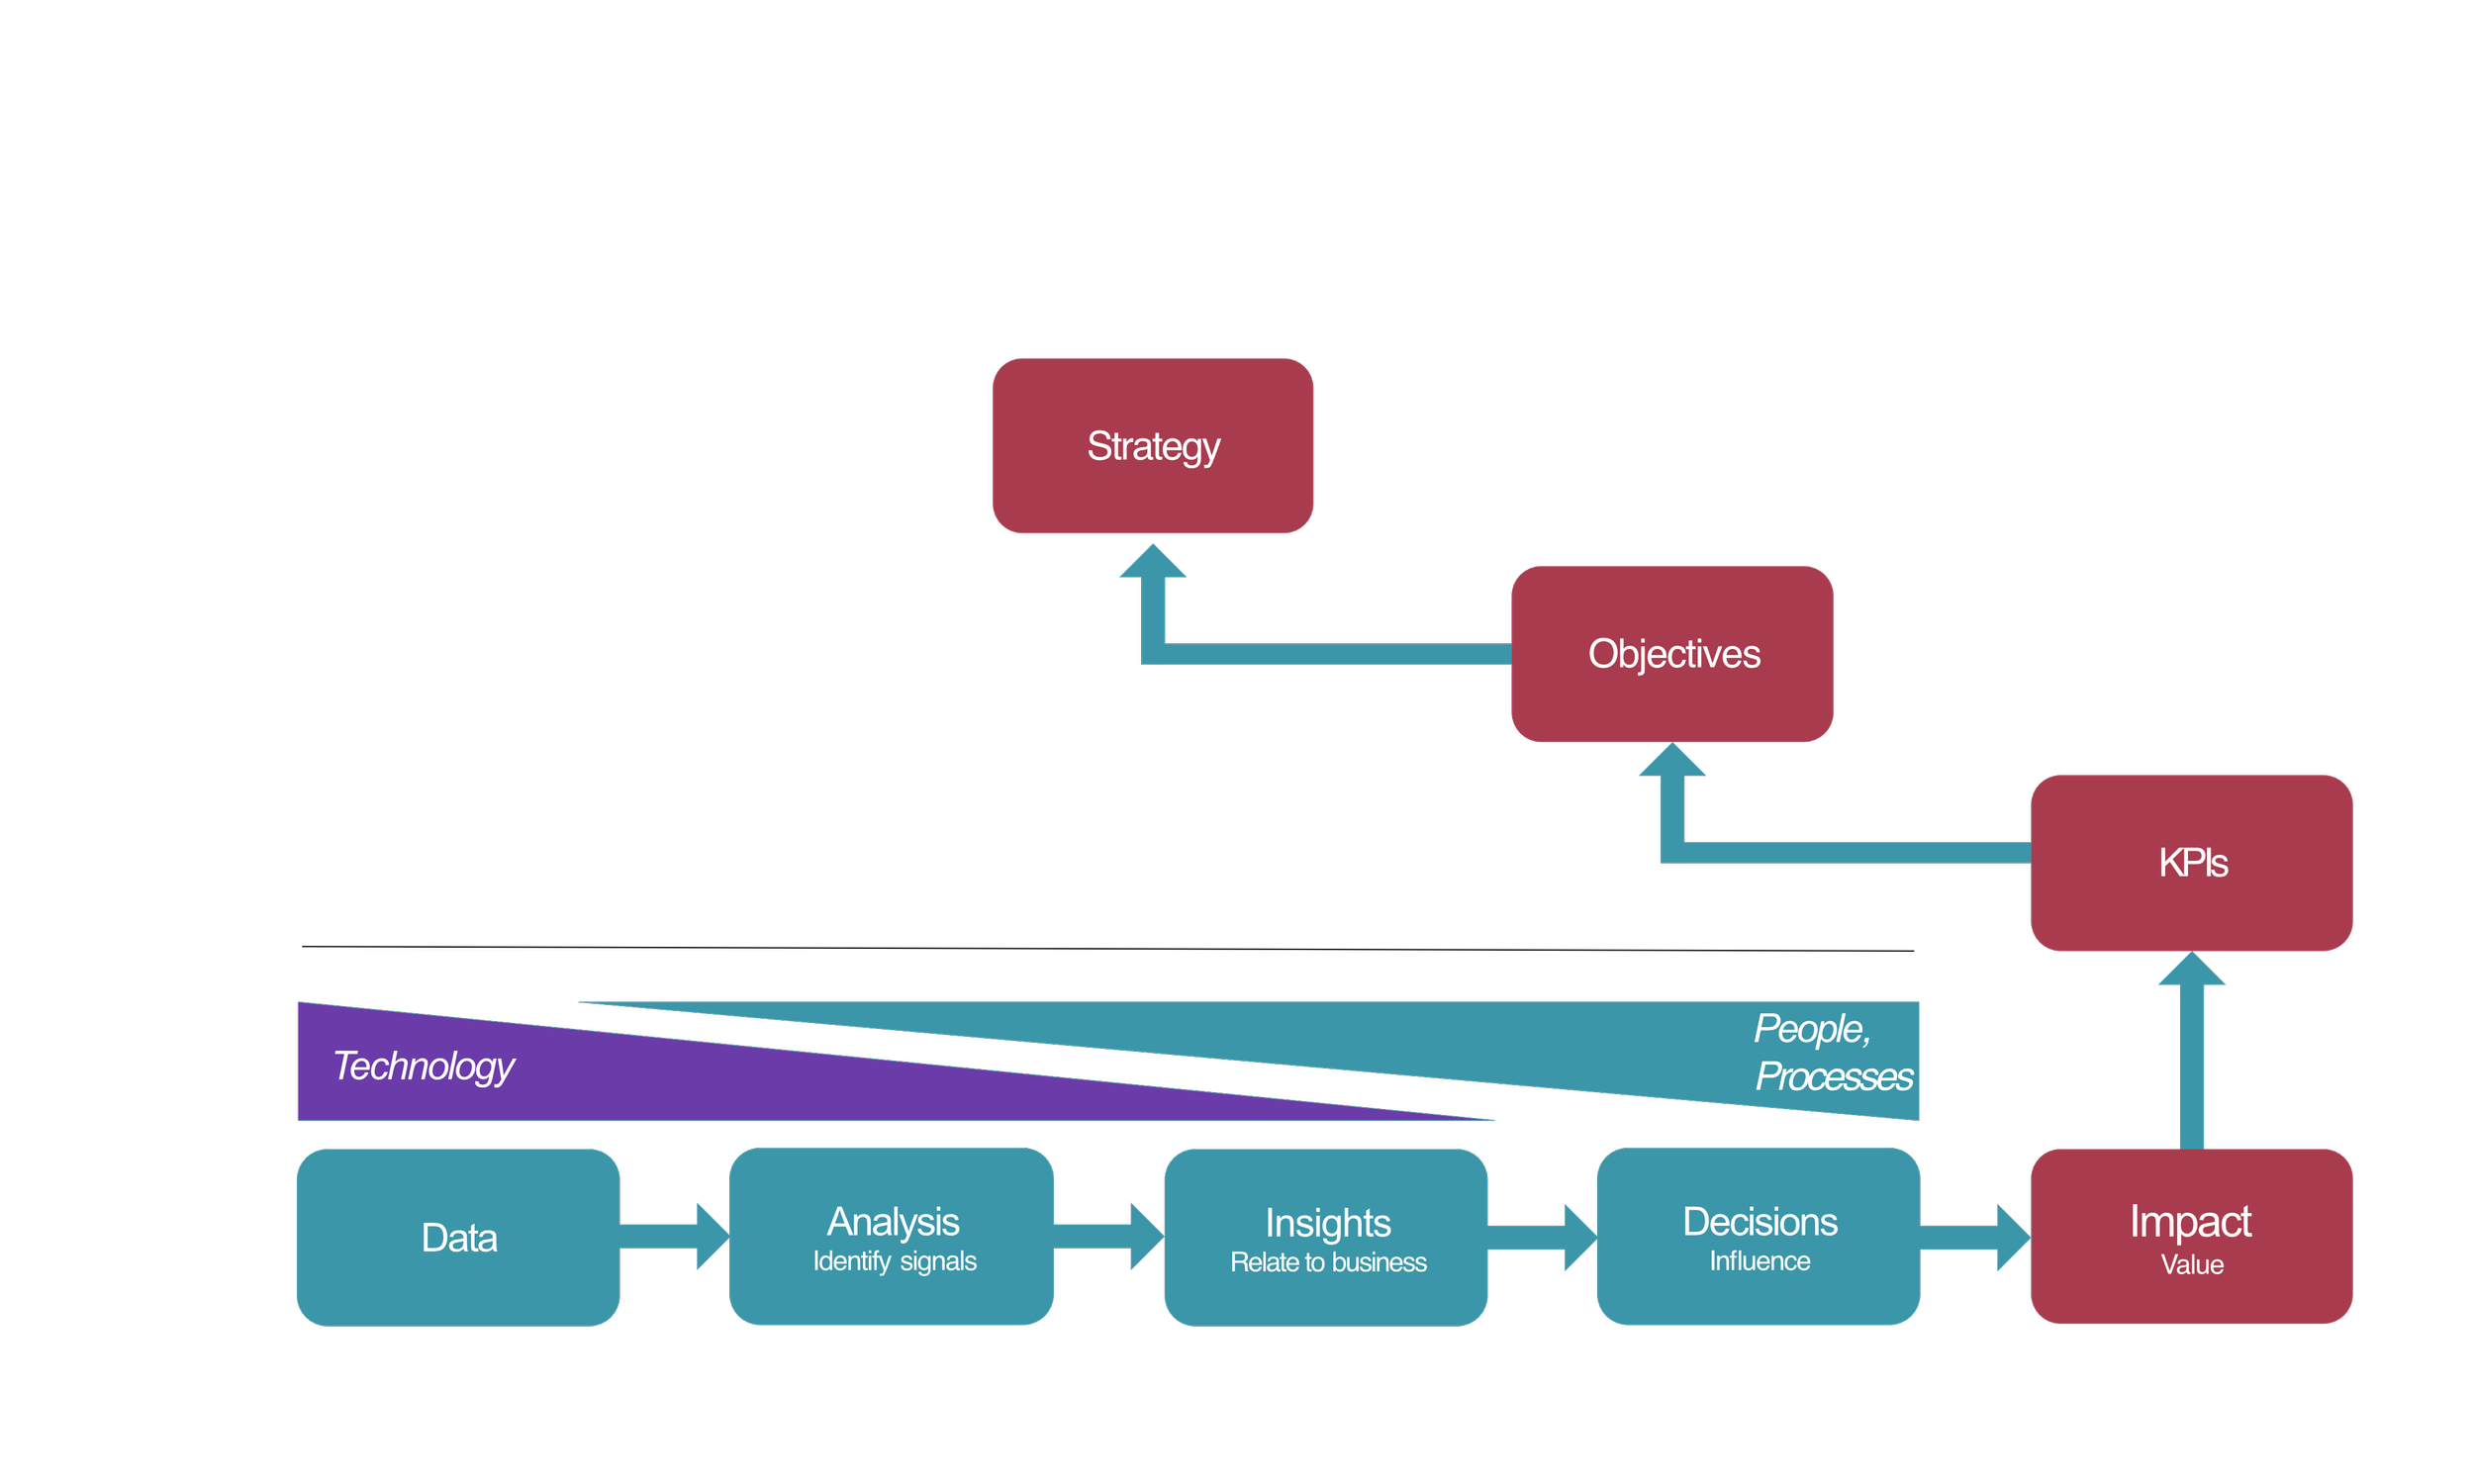
Organisations tend to focus too much on the technology and not enough on the system working together. This is understandable because the technology is more tangible, and usually gathered together under a Chief Information Officer or Chief Data Officer’s responsibilities.

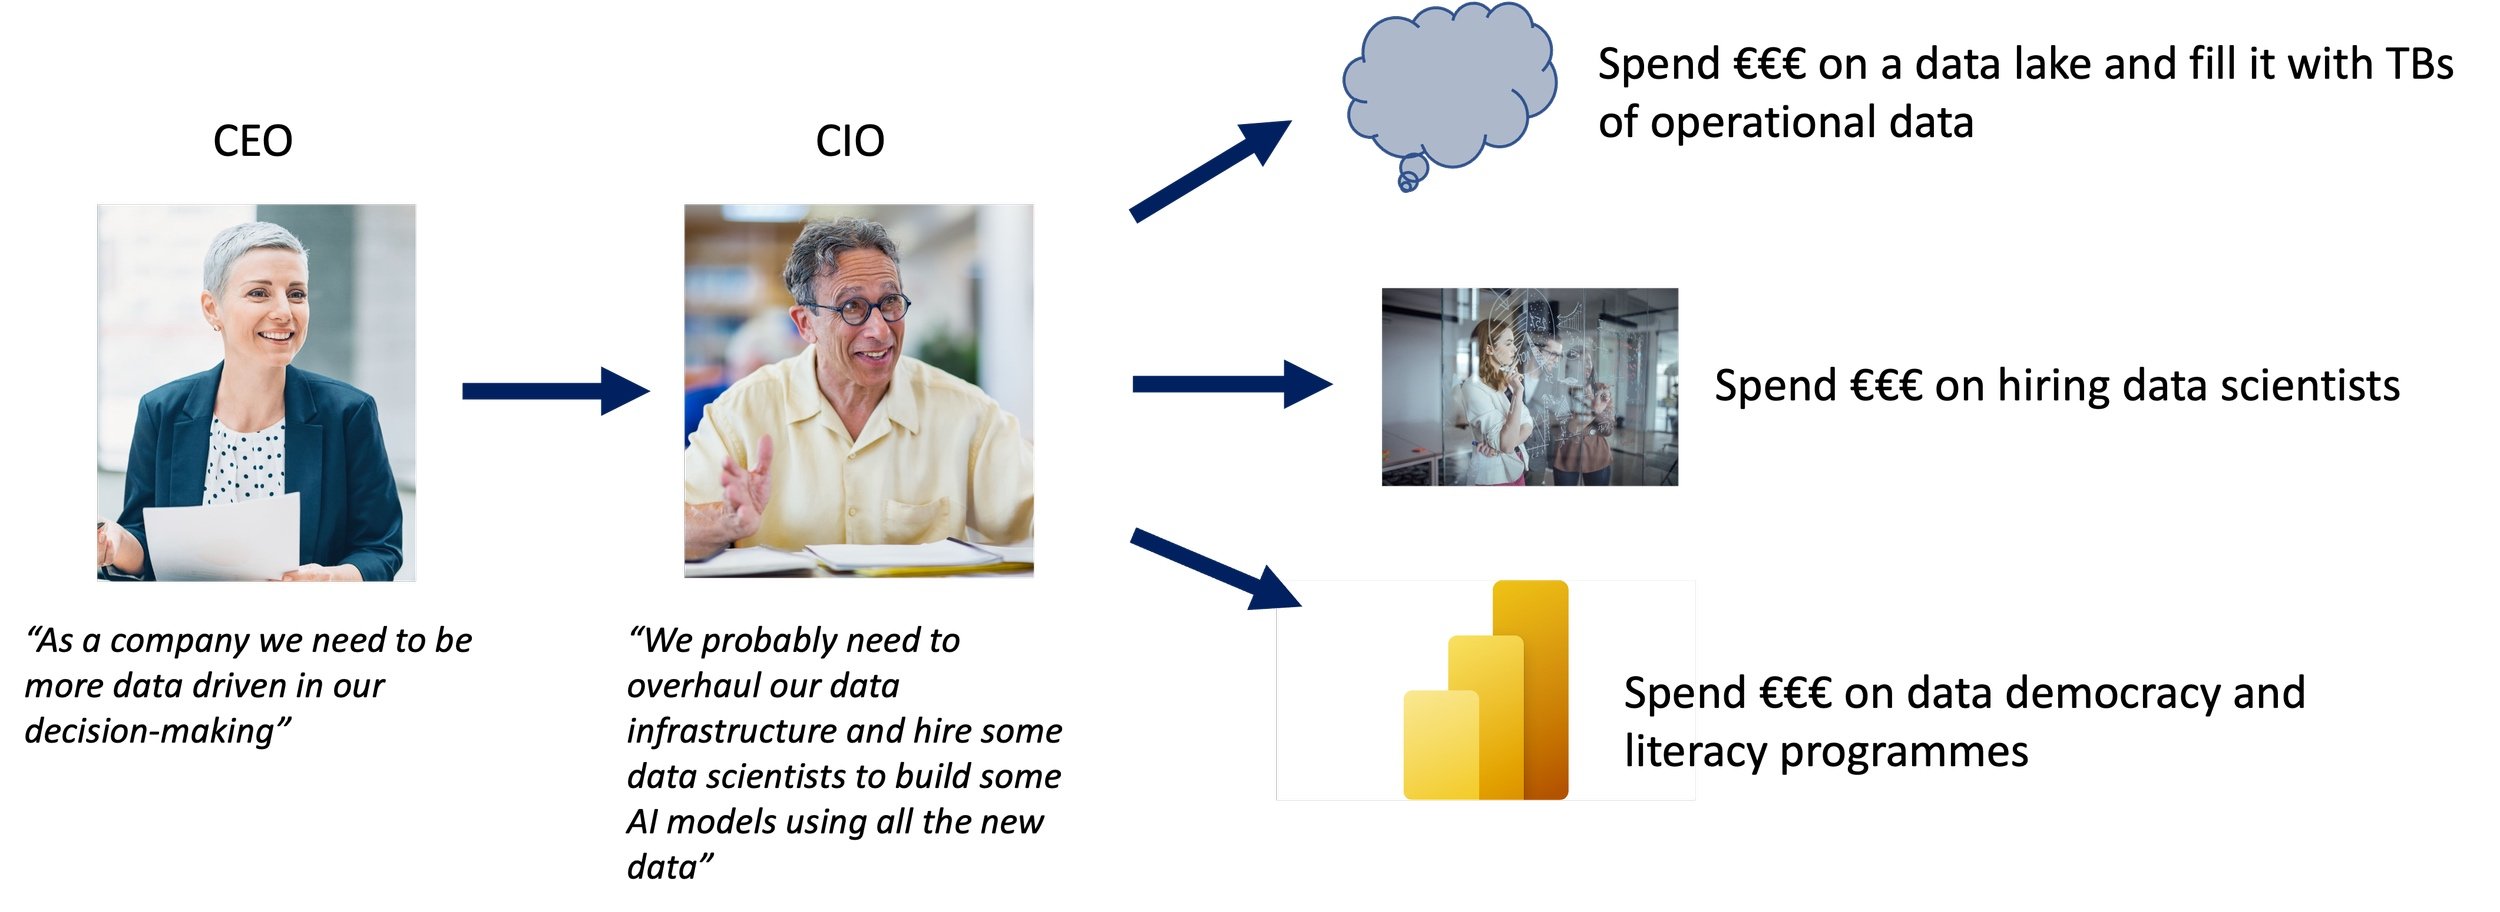
CDO – “I’m responsible for making the company more data driven.  If I make lots of reporting and no-code analytics tools available to everyone (data democracy) and give them enough training then they will just start making better decisions, right?”

There is a growing body of academic evidence that organisations that are more data driven perform better

  • Bryjolfsson & McElheran 2019 find that data-driven decision making (DDDM) is strongly associated with increased productivity. The benefits attributable to DDDM are distinct from those associated with other structured management practices or investment in IT, though the latter is an important complement.

  • Muller, Fay, vom Brocke (2018) find that productivity impact is positive(3%-7%) and significant for industries that are IT intensive (above median) and/or highly competitive (bottom 25% of HHI)

  • Wu, Hitt & Lou (2018) find results that “are consistent with the theory that data analytics are complementary to certain types of innovation because they enable firms to expand the search space of existing knowledge to combine into new technologies, as well as the theoretical arguments that data analytics support incremental process improvements“

So how can Future Consulting help you unlock some of those gains?

We help you identify and prioritise your opportunities for getting value from data (what are the strategic goals and related questions) and then support you in the implementation. As part of this implementation we look for opportunities to improve how your analytics resources are working together – making your analytics production line as lean and responsive as possible.

If you are interested in Analytics Innovation and get in touch.

Everyone wants to be data driven, but no one knows what it means, or how to achieve it

Many leaders say their organisations are struggling

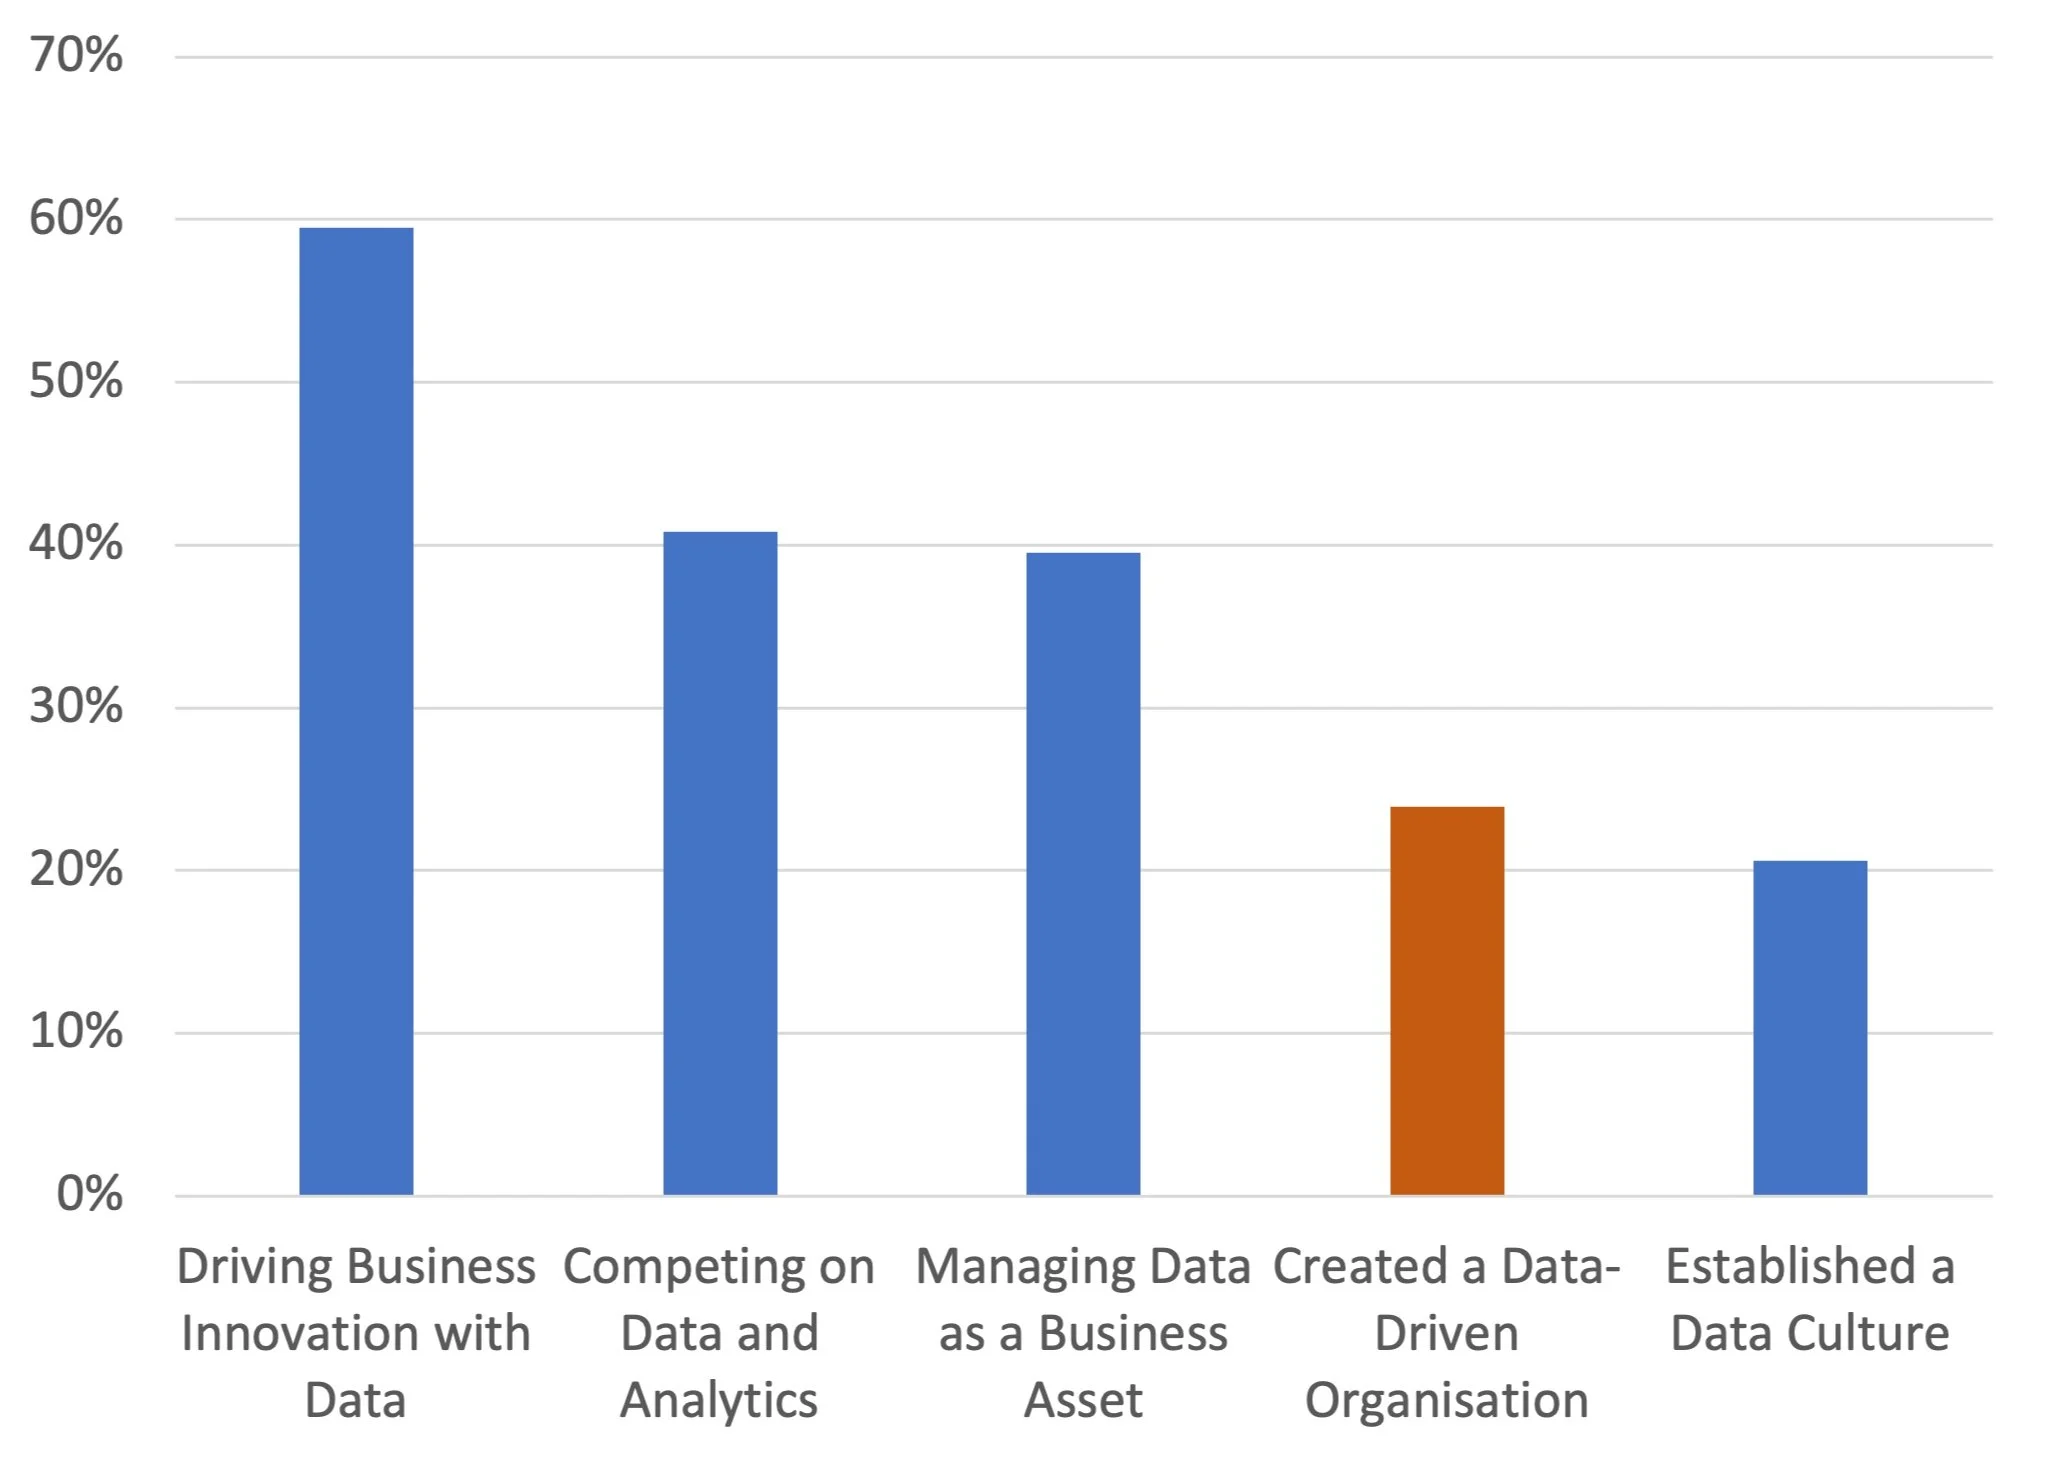
Fewer than a quarter of data executives in leadership positions say their organisation has become data driven.

Some organisations make heavily data-driven decisions because making wrong decisions is very expensive, either because they make a lot of decisions, e.g. banks approving loans, any other organisation approving credit or because the decisions are about very large, non-reversible investments, e.g. oil companies deciding where to drill, FMCG companies deciding what products to make, car companies deciding what cars to make.

Other organisations use data to help them make decisions because of regulatory intervention, e.g. pharmaceutical companies trialling drugs.

Governments use data to help them make decisions about how to spend public money, e.g. in the UK the Public Accounts Committee (a group of MPs from the House of Commons) can request the National Audit Office (an independent public body) investigate anything the government does and check to what extent the public has got good value from the spending. Ministers and senior officials have to explain in public how decisions were taken and how evidence was used to support the decision.

With increasing digitalisation of production facilities, and the workplace in general, more and more data has become available with which to make decisions. The growth in popularity of Six Sigma, Lean and other process improvement methods over the last 20 years has drawn more attention to data analysis where there had not been much before. Now even small start-ups are able to finely tune their business based on tight feedback loops from their website and other systems generating data using off-the-shelf products.

No one is debating that there is a lot of data available, at very low cost, to every organisation.

The challenge is how to get the best value out of it.

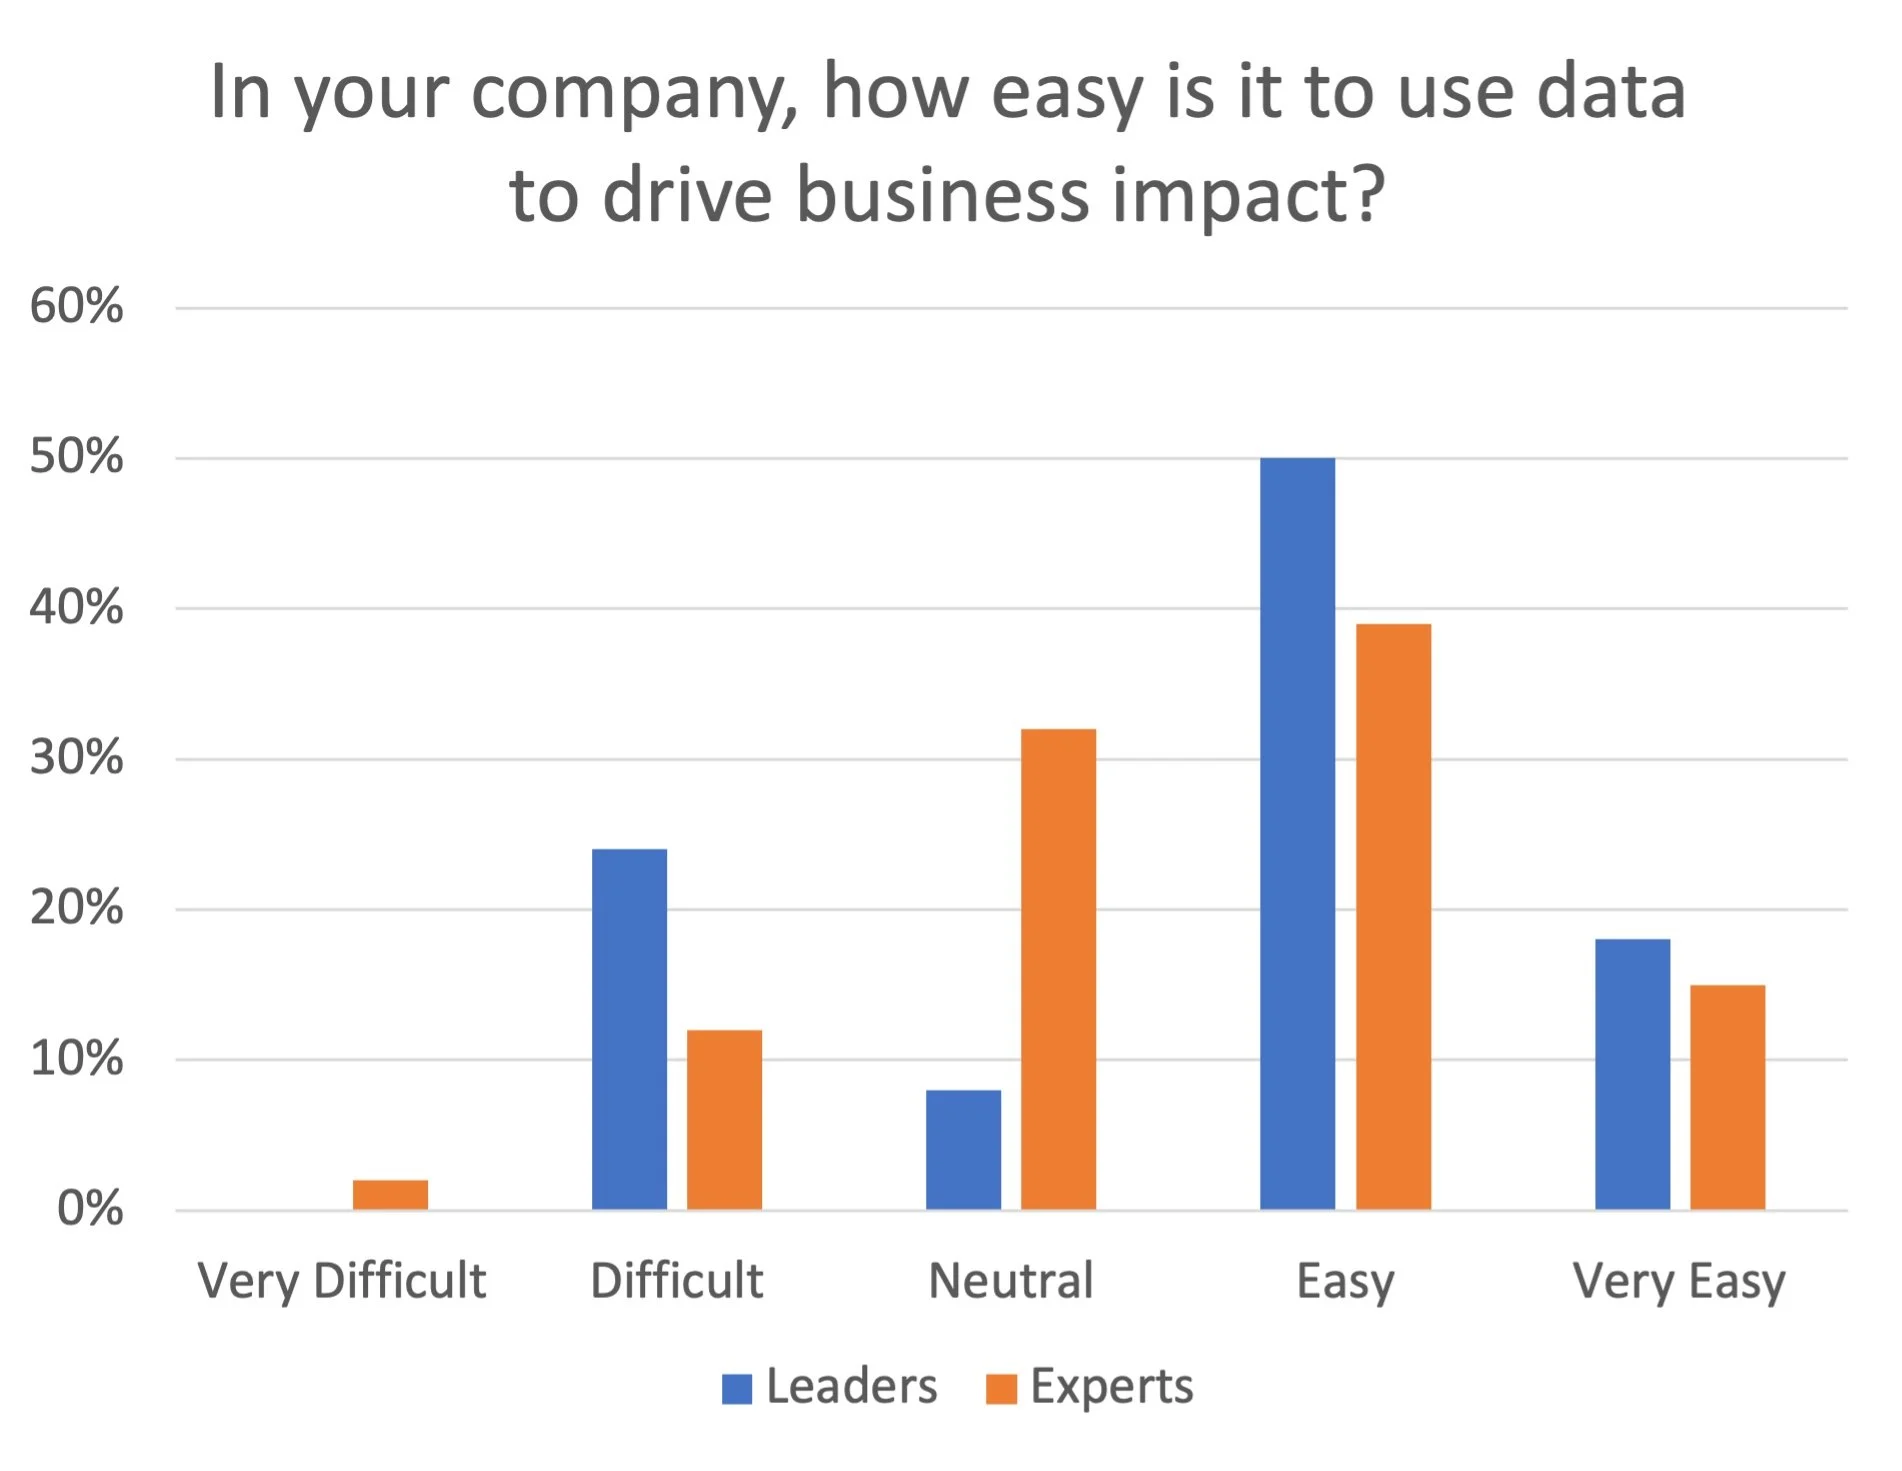
Over a third of Data Leaders and experts think it is not easy to drive business impact with data in their organisation

And Data Experts have an even more pessimistic view than Data Leaders.

Leaders and experts from across the world are all busy proposing solutions to the problem of how to become more data-driven. Your LinkedIn feed is probably full of points of view and articles that are trying to help.

Part of the problem is that becoming more data driven is often seen as a responsibility of the CIO or CTO. There are some solutions which can help but because the issue is bigger than the remit of a CIO or CTO, they cannot solve the problem on their own.

The most common solution

tech / data organisation – “bringing all of our operational, financial, web and CRM data together in a single place will definitely give a small bump in operating margin, right?“

With the growing volumes of data has come an industry supporting its organisation. From data ski lodges to streaming data from your CEO’s brainwaves, there are an infinite range of things you can do to better capture and organise your data.

However technology on its own will not make you more data driven in your decision-making. Having incredible volumes of data sat in AWS and growing by zetabytes every second does not provide anyone in the company with more evidence about what is the best choice to make. It does not help a sales manager decide where to focus their time. It does not help a procurement team reduce their supply chain risk.

Static data does not answer your questions.

data scientists (and how they are organised) – “hiring more nerds will increase operating margin by at least 3%, right?“

Since Big Data and Machine Learning became popular earnings call bingo topics in the early 2010s, hiring STEM Phds to build random boosted binomial tree networks has been become a common strategy to try and demonstrate value from data.

Until recently, some of the most valuable applications of machine learning were out of reach because regulations stipulated that only older, more transparent approaches were allowed, e.g. banks still choose to use binomial logit models for credit approvals because they are very easy to audit compared to other more sophisticated machine learning frameworks.

Nevertheless, predictive analytics has become an important topic in many industries: predicting failure rates in physical systems, predicting which customers are likely to leave.

While there are many valuable applications of predictive analytics, the excitement around it has also crowded out more fundamental, less exciting analysis, like understanding variation in an outcome and what causes it.

The tendency of data scientists to sit under the CTO in many organisations also means that their priorities are aligned with more technological objectives than business-related: “I’ve just invested a lot of money in system x, now I’d better get some data scientists to work on the data to demonstrate system x is good value”.

This ends up looking at things backwards – the most valuable things a data scientist can do for your organisation is not necessarily a subtask on the to do list of the CTO. At the very least, the most important conversations for a data scientist to be part of are not with data engineers and developers, but with people in other parts of the business who can see where impact is needed.

data democratisation – “giving people access to a hundred different dashboards that they can slice and dice will increase operating margin by at least 15%, right?“

74%

Proportion of employees reporting feeling overwhelmed or unhappy when working with data

Source: Accenture/Qlik: The Human Impact of Data Literacy

A more recent theme in discussions about improving decision-making is data democratisation. This is the idea that many employees are constrained in their effectiveness because they do not have enough information at their fingertips, and the solution is to give them more control over what data they can access and how they can access it: interactive dashboards with lots of filters, connected to live data, rather than static pdfs or excel tables. Like the other proposed solutions, this one is not an inherently bad idea. However, it assumes that people have a good understanding of the problem they are trying to solve, and its strategic importance. It also assumes people have the skills and knowledge to navigate the data available to them and use it appropriately to answer their question. This is a very strong assumption.

data literacy – “teaching everyone about all our data sources and why pie charts are evil will surely double our operating margin, right?“

Data literacy is the solution to the issue with data democratisation of people saying they are overwhelmed by the data available to them. It aims to give them the skills to handle it and process it into something they can use to make a decision. Many of the features of data literacy training programmes are similar to what is taught in Lean and Six Sigma, although with less of a process improvement focus. This kind of training is clearly not a waste of money, but it doesn’t necessarily address the problem of business performance because it doesn’t teach people about the kind of questions they should be asking in the first place. This is not something you can learn from Jordan Morrow, nor is it something you can buy from Udemy.

None of these solutions are bad, but they also won’t bring your organisation closer to data driven decision-making. Why?

  • Firstly, these solutions are nugatory and only address one part of a what is a complex and systemic issue. None of the solutions address how data is used in decision-making. None of them address the question of what data, tools, models and graphs are best suited to addressing a particular kind of decision in your organisation.

  • Secondly, they are non-strategic. In particular, tech/data organisation, democratisation and data literacy programmes tend to take a scatter-gun approach, focussing on high volume. Data-driven decision making is partly a cultural challenge and as with other cultural challenges, change needs to begin at the top. Why focus data literacy programmes on more junior employees, when the board and senior executives are the ones making the most expensive decisions?

  • Thirdly, the solutions are not value focussed. None of them start with the business’ goals in mind. Without this, money and time are wasted on endeavours that may deliver some value, but are not necessarily delivering value to a strategic goal.

So what is the solution?

Keep reading.

A firm view on resources

https://www.economist.com/finance-and-economics/2023/04/04/why-economics-does-not-understand-business

When I was first poking my nose into economics as a teenager I came across the famous definition that it is the study of allocating finite resources. Since then I’ve worked in government, at a regulator and for multiple companies, and I can stand very firmly behind the opinion that academic economics has a very poor understanding of how resources are allocated within a commercial organisation, and how decisions are made.

However, there is a field that has been developing quietly over the past twenty or so years that seeks to understand firms as a collection of resources and how these resources can be optimally combined to improve firm performance.

My first encounter with it was while studying the relationship between investment in ICT and productivity. A number of studies looked at complementary business changes/characteristics alongside the introduction of things like email, e.g. email had more of an impact on organisations that had a flatter structure. Lowering the costs to communication makes more of an impact when you can be more effective by communicating with more people.

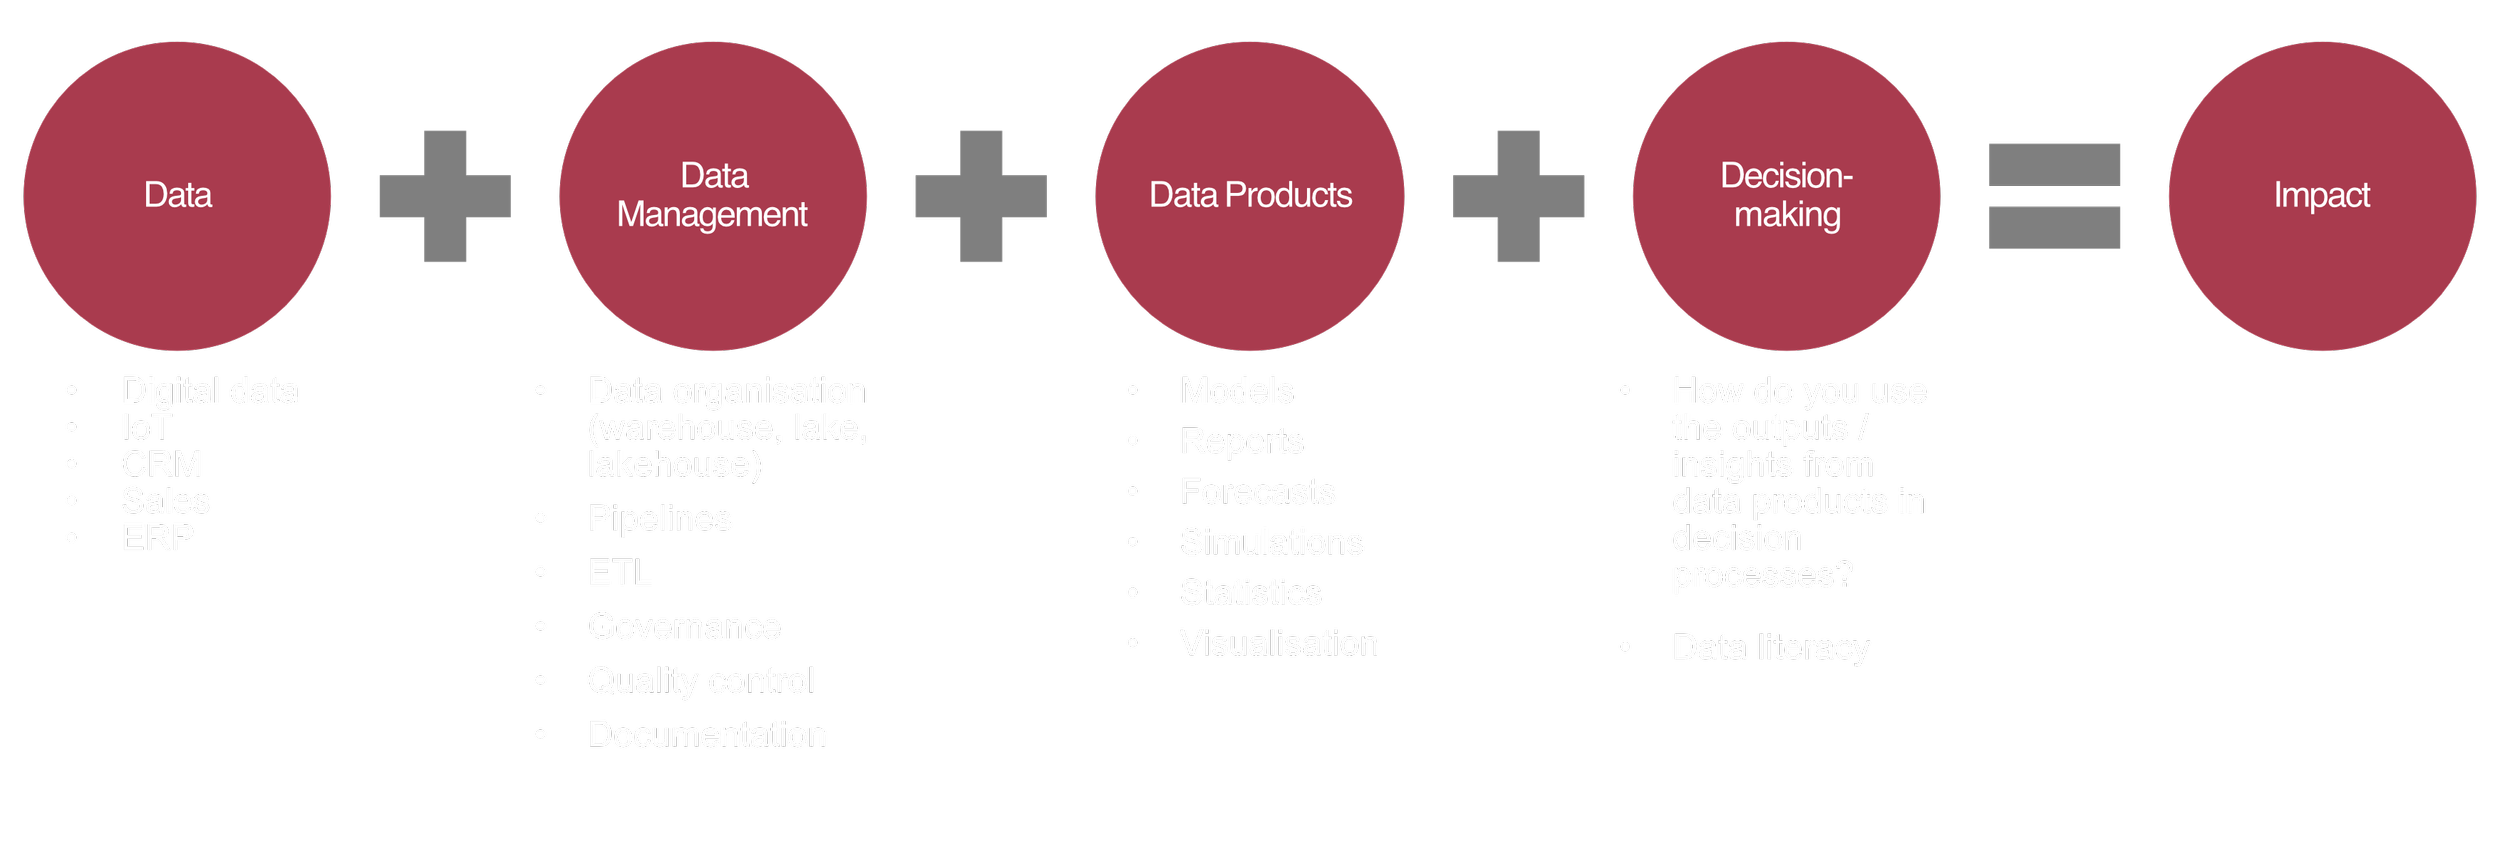
Now everyone wants to be data driven, but being more data driven is so much more complex than dashboards and data literacy classes. I am looking at how organisations can improve their decision-making by not only investing in fancy tech and data infrastructure, but changing how they make decisions and investing in organisational learning. It is not a simple story, and every organisation has different challenges, but there are common themes that can be used to help drive improvement.

Maybe there will be studies we can publish in the future, and someone can revisit this Economist article.

A letter to job applicants everywhere

Over my career I have reviewed a lot of CVs and done a lot of interview panels. After some recruitment activity last year I wanted to share some thoughts with anyone who may ever apply for a job:

Dear Job Applicants,

If you think you are qualified for a role and want to improve your chances of success (at least with hiring managers who share my view of the world!) then here are some tips based on my own experience.

Talk about the impact you had. I want to hire someone who is going to have an impact on my organisation. The best way to find this is by hiring people who have had an impact before. You can do lots of interesting things but if it doesn’t deliver value of some kind then you’ve been doing a hobby, not work.

Think about why you want to work for a company. When you commit to a relationship with another human being you usually can articulate why you want to spend more time with them, and maybe make big financial commitments together, and maybe have children. Working for an organisation is not as big of a commitment, but you should be able to articulate why you want to enter in to the relationship.

Make it easy for the interviewer to assess you. Listen to the question. If the interviewer is trying to get you to talk about a specific competence then use the STAR method. If the company publishes information about its values or competency framework then use this in your preparation. Prepare STAR type answers based on the values/competencies. This will also help you understand whether this job really is for you. If you can’t find any examples from your recent career where you have demonstrated the competencies/values and made an impact then maybe you shouldn’t be applying for a role there…

I am not hiring the team you worked with. I’m interested in hiring you. Therefore, do not answer my questions using “we did”, “we asked”, “we prepared”. What did YOU do?

You are highly likely to get screened out early on if you do not tailor your cover letter in any way. No one likes to go on a date where your partner has five other people sitting at other tables in the cafe. It’s the same with work – demonstrate some focus.

Finally, don’t forget to think about your values and objectives and what questions you should ask to find out if the organisation is aligned to you. Not only does this help you understand if the role is right for you, but also it demonstrates you are conscientious and thoughtful.

Good luck with your applications.

Kind Regards,

A Tired Hiring Manager

The dangers of old people

Last week I wrote about how it’s ok for governments to spend more than their tax take when the economy is depressed.  This week I’m going to show that while additional spending can be helpful to kick-starting the economy, there are good things to spend the money on, and there are less good things.

The current government made a big fuss in 2010 about how it was going to protect the incomes of pensioners by guaranteeing to increase the Basic State Pension by the highest of inflation (the Retail Prices Index), average earnings, or 2.5%.  This might seem like a nice policy, something to make us all feel warm and fuzzy about making sure that pensions can take care of themselves.

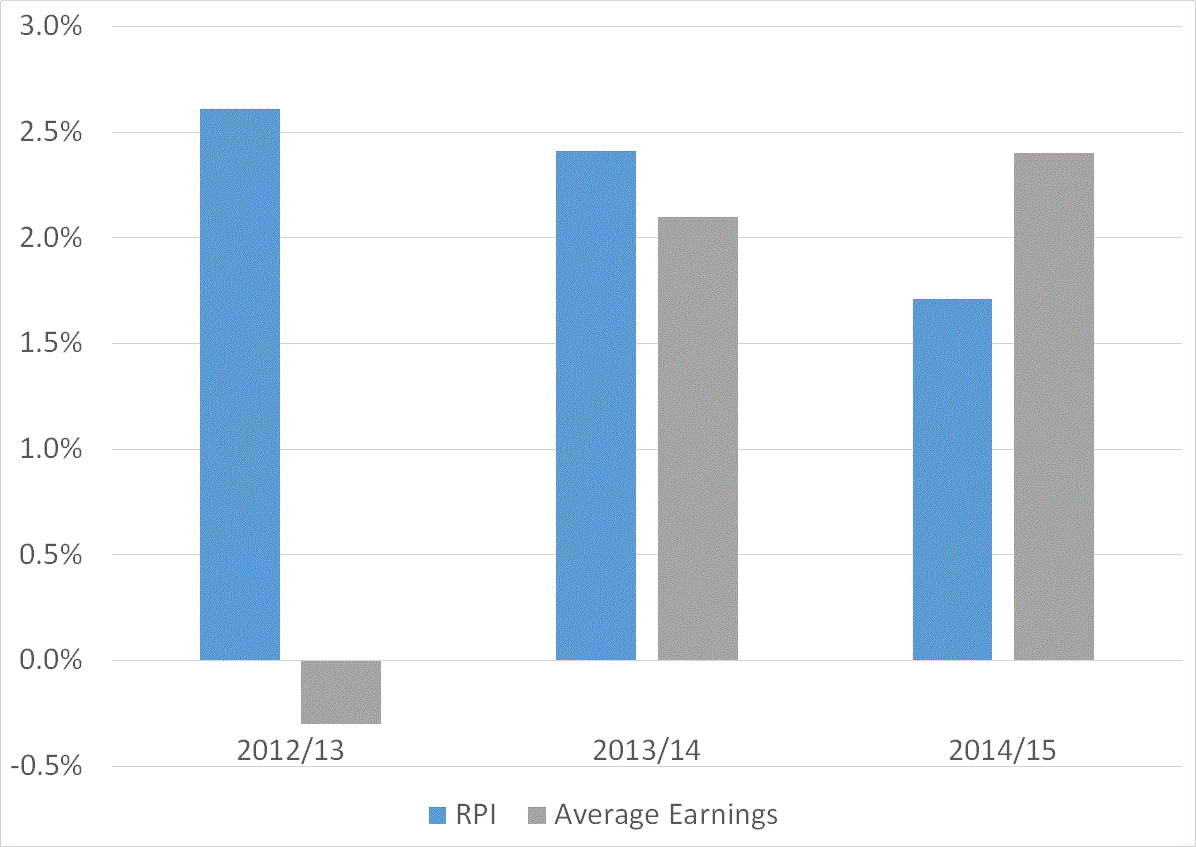
However, this policy has been incredibly expensive.  In 2012/13 RPI inflation was 2.6% and average earnings fell by 0.3%, so all the oldsters got an additional 2.6%.  The total spend on the Basic State Pension in 2011/12 was £74.2bn.  Therefore increasing the pension rate by 2.6% increased the spend on State Pension by £1.9bn.  The value of the increase above average earnings (2.6% – -0.3%) was worth around a quarter of a billion pounds.

blog_graph_pensions

Since then each year pensions have got another 2.5%.  Boom – another cool two billion to spend on cruises and Werthers Originals. Average earnings have picked up but continue to grow at less than 2.5%.

The problem with this is that there are many, many more things that government could spend money on which would do more good for the country than shovelling cash into the pockets of old people.  For example, the UK Apprenticeships programme has been successfully providing young people with skills that employers explicitly want.  It has been evaluated as adding £18 to the economy for every pound of government money spend on it.  That is a return of 1800%.  Not bad Vince. Not bad.

You might be asking what is the return on spending on pensions.  Zilch.  A pound spent on pensions is merely moving money from one pocket to another.

In 2013/14 the total spend on all Enterprise and Skills programmes in the UK was £4bn.  The increase in spending on State Pension was half of the total spend on Enterprise and Skills.

If just a quarter of that increase were used for Apprenticeships that would mean the economy would not be only £250m better off, it would be £4.5bn better off.

Crappy spending decisions like the Triple Lock is why governments that listen disproportionately to old people are not good economic stewards.

Young people: Vote!

Older people, if you want your children and grandchildren to live in a wealthy society, don’t listen to the siren calls of bigger cash transfers. (and tell your children and grandchildren to vote).

Governments shouldn’t worry about red ink.

In this age of blogs, Twitter and newsfeeds the default position for most people is to ingest content that they find agreeable and which is presented in digestible chunks.  When 140 characters is the go-to format for most opinions, a 500 word piece for a blog or a newspaper is rarely on the menu.  Many of the arguments against the coalition government’s policy of fiscal consolidation have therefore attempted to conform to the preferred format of the content browsers who flit from one opinion tree to another.

This has meant that many opinions end up sounding shrill (Laurie Penny and Owen Jones, I’m looking at you) or failing to convey the subtlety that is important to so many economic issues.

An article by Oxford economist Simon Wren-Lewis in the latest issue of the London Review of books illustrates starkly why this is dangerous. (yes, it’s more than 500 words)

Public endorsement of the policy of fiscal consolidation (or austerity) has been fed by the presentation of the economy as being like a household or a business that has to balance its books to survive.  This simple analogy has been used by the Chancellor to demonstrate the Conservatives’ frugality and competence at economic management – everyone else has to try and stay in the black, so government should too.

This view has been mostly swallowed whole by the media and regurgitated to the public with little criticism. Media economic correspondents and commentators have tended to focus on the views of City economists who, as Wren-Lewis points out are generally either trying to be sensationalist or advance the interests of their investor clients.

The fact that the coalition government continues to poll well on economic management is based on the public having a completely wrong view of how a national economy actually works.  Regardless of whether you think the country would be better off with a smaller state, we should all be appropriately informed about the pros and cons are of the various ways of achieving it.

“Balancing the books” of government when the country is in a recession is a very bad idea. A very, very bad idea.

If a business or household is constantly spending more than it earns then its stock of debt will increase. For a business, increasing debt to make an investment can increase revenue, but using debt to finance your operations isn’t going to end well if there isn’t some external factor that is going to improve your margins.  Using debt to finance an investment is still risky as well because it may not pay you back – people might not buy the product, the oil well might be no good, the big machine may not be reliable.

When you’re running a national economy many of the constraints a business faces are absent.  For example, a government’s revenue comes from taxes.  Taxes increase with economic activity, either from income tax, corporate profits or consumption (via VAT).  Therefore, if a government can increase economic activity then they may be able to achieve a prolonged increase in tax revenue as people continue to spend money and add value with services and products.  Reducing current taxes is one way to do this – VAT was reduced in 2009 as a way to stimulated purchases.  Increasing spending is another way to stimulate economic activity.  Investment is a particularly good way to stimulate activity because an asset is created which generally delivers some improvement to the country’s infrastructure (better broadband connections, better roads etc, better school buildings) and also results in the people working on the infrastructure having more money in their pockets to spend on goods and services. The first effect is a bit risky; like the big machine, it may not work as intended.  However, if you pay a company to build a road then the workers and owners are definitely going to be better off.

The only thing that ever prevents this from being maximally effective is if people save the money they have.  In some countries this could be an issue: Japan and Germany.  However, one thing the UK population is particularly good at is spending money!

There are various ways to pay for these types of policies, but that is a separate issue.  The analogy of balancing the books with respect to budget deficits is completely bogus – the media should stop being so ignorant about the issue, academia should help them do this, and we the public should beware of politicians who present such simplistic arguments.

In 1925 Winston Churchill followed a similar policy to Osbourne’s in order to maintain the gold standard.  The British economy was crippled by debts to the USA after WW1 and Churchill’s attempts to ‘balance the books’ brought the country to its knees.  Things only really started improving with re-armament after 1935.  This was such an appalling misjudgement that John Maynard Keynes wrote a 32-page essay called The Economic Consequences of Mr. Churchill on why Churchill was an idiot.

If only Keynes were alive today (if only…), he would have written The Economic Consequences of Mr. Osbourne, and he would have been able to summarise it in 140 characters.

Good management: take your hand off the saddle.

The Harvard Business Review Ideacast podcast recently had an interesting interview recently with Eric Schmidt and Jonathan Rosenberg, Google’s former SVP of Products.  The subject was lessons from Google about how to manage talent, which are documented along with other lessons in a new book the pair have written (“How Google Works”).

The main point they were making was how to successfully recruit and then make best use of technical creative people such digital product designers and developers.  The key thing that stuck out for me was the challenge of managing this kind of talent in the most effective way and it made me reflect on my own experiences of managing people.

One of the key challenges as a manager is overcoming the temptation to exert too much control and trust your team to solve the problem.  This stems from a natural concern for quality and timeliness, which are clearly desirable concerns to have. However, the temptation is then to over-specify the outcome you want in order to delivery high quality on time.  What this then often leads to is your team either constantly having to check back in with you to find out if they are going in the right direction, or delivering something which doesn’t fit in with your specific vision. They then get disenchanted and demotivated and the project gets delayed or derailed.

A much more effective way to delegate to your team is give them the problem, rather than dictating a solution you have already come up with.  In giving them the problem, you also have to give them all the knowledge you have that is relevant to it – who are the key people to talk to, what are their motivations, what data will be useful, what are the key risks with it.  How much knowledge you give them is obviously determined by their experience, how important/risky the project is, and how much you want them to have to find out about things for themselves.  However, the simple principle of giving them the problem, rather than the solution will have many benefits with the main one being that the outcome will be the result of input from the whole team rather than just the manager.  If you have have put a lot of effort into recruiting talent, then this is clearly what you want!

My most rewarding example of this was when I was able to hand over the writing of a ministerial submission to a student who had been working for me for the last year.  By giving her as much information as I knew about the situation and the freedom to solve the problem in her own way she was able to effectively communicate the issue to our minister with very little input from me.

Size doesn’t matter

…at least when it comes to information!

As the statistical nerds amongst you may be aware, there is a bit of a backlash going on against “big data”, fueled partly by discovery of the hubris in Google’s attempts to predict flu outbreaks. Tim Harford is thankfully on the front line, as well as the Economist.   Health sector colleagues have also focused on the particular limitations of the application of “big data” philosophy to health.

The conclusions that these critics have come to is one that those who have any knowledge of statistics had probably already drawn: apart from for some very specific purposes, there is very little to be gained using “big” datasets. Once you have a good conceptual understanding of what is generating your data, the value of an additional data point drops exponentially after the first 10 or 20.

This can be demonstrated using an example from physics. Start off by talking to your friendly neighbourhood physicist, and she will tell you that there is a law to explain the relationship between the temperature of a strip of copper and its length. Armed with this knowledge you can then perform an experiment to test it, observing a strip of metal at different temperatures. This will give you a graph that might look like this:

temp1

With only 10 data points it is trivial to verify the prediction of how copper will expand. Another 10 is not going to change your conclusion, nor make you much more certain about it:

temp2

Much of the noise about big data has come from the IT industry, for whom big data does present some non-trivial problems. For example, there is the oft-mentioned fact that Rolls-Royce jet engines generate hundress of gbs of data every second. Getting this data off a plane, stored somewhere and fed through some system for detecting malfunctions is a real feat of computing.

I’m not going to reiterate the flaws in unconditional claims of boosters of Big Data as others mentioned above have done this much more eloquently. My plea is much more practical and relates to something we all have a personal interest in.

The scandal surrounding care.data  quite reasonably frightened a lot of people. Most people in the UK view their medical records as very personal information and the way the potential re-use of this information was presented left a lot to be desired.

However, the real tragedy of this episode was that it delayed for years an innovation that could be the most powerful force for improving the effectiveness of the NHS, and reducing its costs. This innovation is linked data. It is not a complicated idea, just that of joining up information so that information about how someone is treated in one place is joined up to how they are treated in another.

As described in the article in the Health Services Journal by Axel Heitmueller and Sandy Pentland (linked above, and again), joining up multiple data sets, in particular across different care settings (for example acute hospitals and community providers) brings many more benefits than ‘big’ data as commonly shouted about.  The aim of Care.data was really to facilitate medical research.  However, for the NHS at the moment it is much more important that current treatments are delivered more efficiently.  Rather than glamorous product innovation to create new treatments, this means process innovation: making things work better.

The primary benefit of linked data is in helping healthcare providers and regulators better understand patterns of healthcare and provide a more seamless journey for us, the patients.  Everyone has an incentive for this to happen – patients obviously have a better time if the people caring for them can talk to each other and provide a smooth journey between services, and as documented by the vast literature on Lean, providers invariably save money when customers/patients have a better journey.

Rather than being distracted on the one hand by silly market fads about big data, and on the other by the merits of sharing medical data, let’s all demand something that undeniably benefits patients and also has the potential to save the NHS a lot of money.

Here is a message to go and repeat wherever you can – “link my data!”