Birmingham’s claimant count is the highest of any local authority in Britain: 78,000 people in August 2026, 10% of everyone of working age, against 7% in the next highest places. It gets read as proof of the city’s decline. It is not a count of people out of work, and most of its recent rise was decided in Westminster.
The city does have a serious employment problem, and it is a much larger one. Just 67% of Birmingham’s people of working age are in work, against 76% across England: a shortfall of about 68,000 people. That gap has run between eight and fourteen points in every year since 2004, and it barely moves. Birmingham’s claimant count sits about 8,700 above its own 2022 share of the national total – less than an eighth of the employment shortfall, on a number that swings with the rules.
The number that moves is not the number that matters.
The count is not a count of people out of work
It counts everyone required to look for work as a condition of their benefit, which includes people already in a job if they earn below a threshold the government sets.
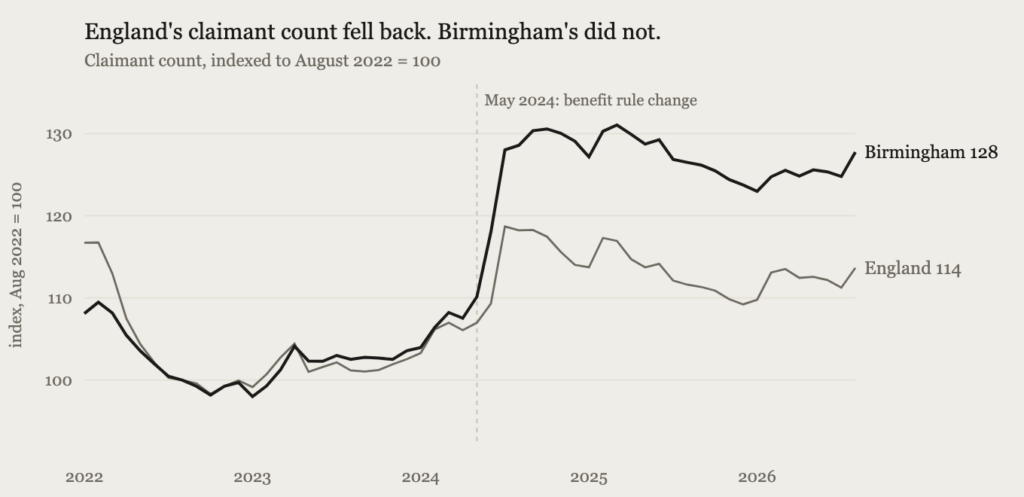
That threshold moved twice. In January 2023 it rose to £617 a month; in May 2024 it rose again to £892. The Department for Work and Pensions estimated that the two changes would bring 120,000 and then 180,000 more people into the count. Nobody lost a job. The effect is plain in the national series: England’s count went from 1.32m in August 2023 to 1.55m a year later, and has since drifted back to 1.49m.
Low pay and no work are not the same condition, and the count does not separate them. Trussell found that 30% of people referred to food banks in 2024 were in working households. Birmingham is a lower-paid city than most: median monthly pay for its payrolled employees was £2,400 in August 2025, against £2,600 across the UK, and it has run 7% to 9% below the UK figure for a decade. A threshold set in pounds a month catches a larger share of workers in a lower-paid city.
The Department for Work and Pensions publishes the split between claimants who are working and those who are not at national level only. How many of Birmingham’s 78,000 have a job is therefore not knowable from published data.
The gap that does not move
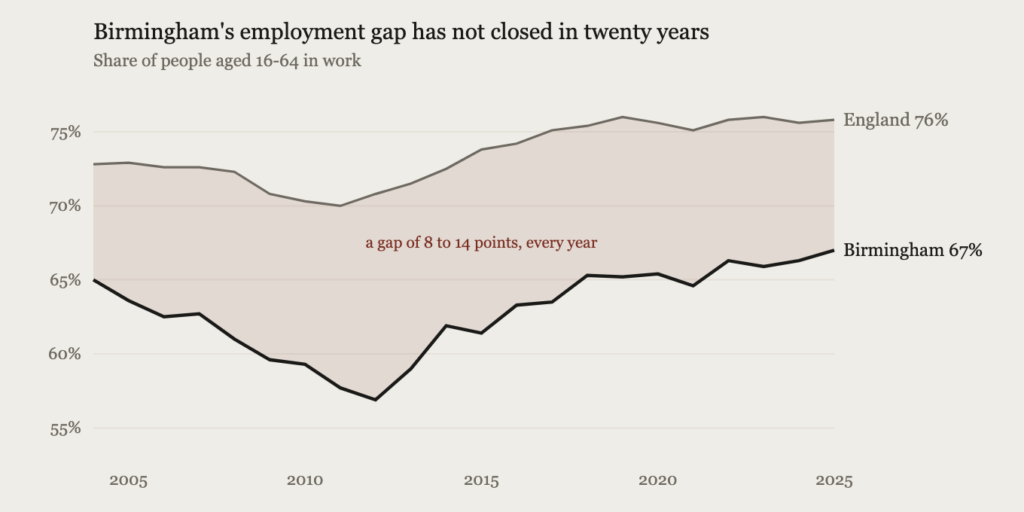
In the year to March 2026, 67% of Birmingham’s people of working age were in work. The figure for England was 76%. That gap is not new. It has been there every year the survey has covered the city: eight points at its narrowest, in 2004; fourteen at its widest, in 2012; nine in 2025. Economic inactivity shows the same shape, 27% against England’s 21%.
Across Birmingham’s 760,000 people of working age, a nine-point gap is about 68,000 people. The claimant count, by comparison, is around 8,700 above what the city’s 2022 share of the national total would predict. The larger number has held for two decades without making news; the smaller one moved on a rule change and made headlines.
Where the gap shows
It shows at the bottom of the labour market. In July 2026 the University of Birmingham’s City-REDI institute published Inspiring Futures, commissioned by the Rigby Foundation, describing a “perfect storm” in youth employment. Its central finding concerns the first rung: entry-level or “starter” jobs in the area have fallen by 49% in a decade. The report projects a £3.1bn output loss and 28,000 fewer jobs across the West Midlands by 2030 if that is not reversed.
Professor Anne Green, the institute’s co-director, said the employment and skills system “remains too fragmented, and outcomes are not yet where they need to be.” Steve Rigby, who funded the work, said: “we are not facing a failure of ambition among young people, but a failure of opportunity.”
In May 2026 Birmingham had 16,000 claimants aged 18 to 24, a rate of 19%. And it reaches the classroom: in January 2025, 45% of the city’s pupils were eligible for a free school meal – 92,000 children, the highest proportion of any local authority in England. The share rose by more than three percentage points in a year, among the largest increases in the country, alongside Newham and Tower Hamlets.
The number to watch
Two decades of that gap have outlasted the financial crisis, austerity and a pandemic. It widened to almost fourteen points by 2012 and has narrowed since, but it has never dropped below the eight points recorded in 2004.
The claimant count will keep moving. It rose when Westminster raised a threshold, fell when the effect washed through, and will move again the next time the rules change. None of that will say whether Birmingham is catching up. The employment rate does, and the city has not.
A note on the figures. The employment rate comes from the Annual Population Survey, which is a sample. The Office for National Statistics publishes a confidence measure alongside it, plus or minus 3.1 points for Birmingham against 0.3 for England, but does not document how that measure is derived. The gap is about three times it and carries the same sign in all twenty-two years, which is why a single year’s movement is not read as a trend here.
Sources. Claimant count, employment rate and economic inactivity: ONS via Nomis, to August 2026 and to the year ending March 2026; Birmingham City Council’s own monthly update gives 77,925 and 10.1%, against 77,930 from Nomis. Payrolled employees and median pay: HMRC PAYE Real Time Information. Free school meals: DfE spring school census, January 2025. Threshold changes: DWP regulations and Hansard. Starter jobs, youth employment and the quotations: City-REDI, Inspiring Futures, 15 July 2026. Food bank referrals: Trussell.